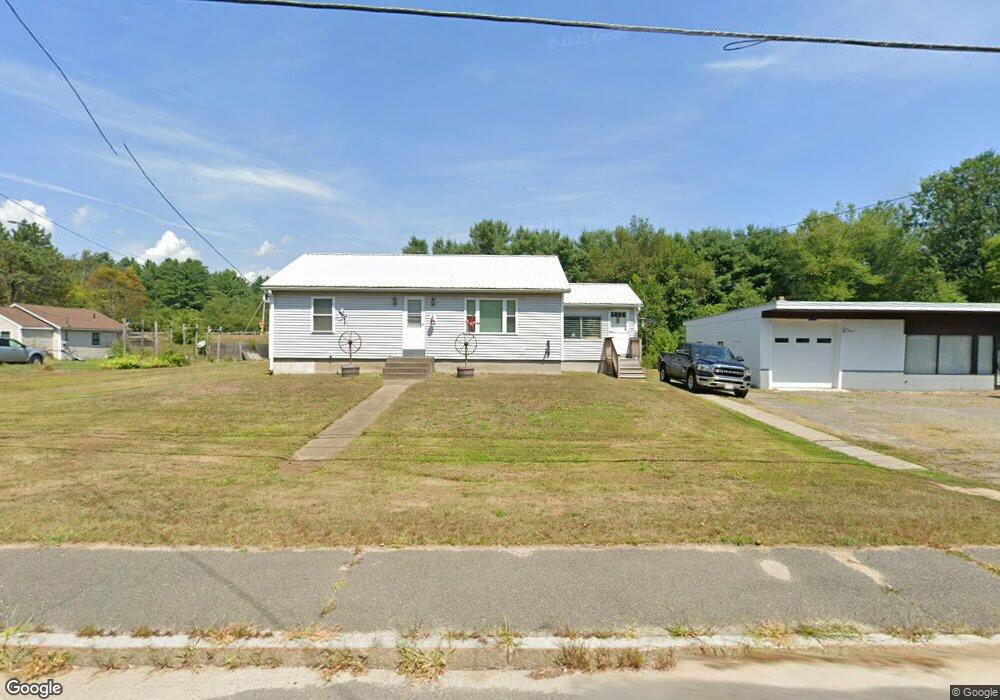
535 E Main St Orange, MA 01364
Estimated Value: $258,000 - $324,000
2
Beds
1
Bath
1,128
Sq Ft
$248/Sq Ft
Est. Value
About This Home
This home is located at 535 E Main St, Orange, MA 01364 and is currently estimated at $279,647, approximately $247 per square foot. 535 E Main St is a home located in Franklin County with nearby schools including Fisher Hill and Ralph C Mahar Regional School.
Ownership History
Date
Name
Owned For
Owner Type
Purchase Details
Closed on
Aug 29, 1990
Sold by
Thompson Sandra L
Bought by
Desreuisseau Steve M
Current Estimated Value
Home Financials for this Owner
Home Financials are based on the most recent Mortgage that was taken out on this home.
Original Mortgage
$32,000
Interest Rate
9.85%
Mortgage Type
Purchase Money Mortgage
Create a Home Valuation Report for This Property
The Home Valuation Report is an in-depth analysis detailing your home's value as well as a comparison with similar homes in the area
Home Values in the Area
Average Home Value in this Area
Purchase History
| Date | Buyer | Sale Price | Title Company |
|---|---|---|---|
| Desreuisseau Steve M | $5,000 | -- |
Source: Public Records
Mortgage History
| Date | Status | Borrower | Loan Amount |
|---|---|---|---|
| Closed | Desreuisseau Steve M | $44,000 | |
| Closed | Desreuisseau Steve M | $32,000 | |
| Previous Owner | Desreuisseau Steve M | $20,000 |
Source: Public Records
Tax History
| Year | Tax Paid | Tax Assessment Tax Assessment Total Assessment is a certain percentage of the fair market value that is determined by local assessors to be the total taxable value of land and additions on the property. | Land | Improvement |
|---|---|---|---|---|
| 2025 | $34 | $207,500 | $21,000 | $186,500 |
| 2024 | $3,075 | $176,300 | $21,000 | $155,300 |
| 2023 | $2,762 | $153,800 | $18,900 | $134,900 |
| 2022 | $2,585 | $135,200 | $18,900 | $116,300 |
| 2021 | $2,775 | $138,400 | $34,700 | $103,700 |
| 2020 | $2,665 | $131,100 | $31,700 | $99,400 |
| 2019 | $2,394 | $106,300 | $27,400 | $78,900 |
| 2018 | $2,247 | $102,400 | $25,600 | $76,800 |
| 2017 | $2,310 | $108,800 | $32,000 | $76,800 |
| 2016 | $2,220 | $102,300 | $28,600 | $73,700 |
| 2015 | $2,214 | $106,600 | $30,500 | $76,100 |
| 2014 | $2,146 | $108,700 | $30,500 | $78,200 |
Source: Public Records
Map
Nearby Homes
- 537 E Main St
- 525 E Main St
- 550 E Main St
- 552 E Main St Unit 554
- 552 E Main St
- 499 E Main St
- 564 E Main St Unit 566
- 564 E Main St
- 561 E Main St
- 579 E Main St
- 483 E Main St
- 576 E Main St Unit 578
- 587 E Main St
- 475 E Main St
- 673 E Main St
- 595 E Main St
- 2 New Athol Rd
- 1 New Athol Rd
- 437 E Main St
- 435 E Main St
Your Personal Tour Guide
Ask me questions while you tour the home.