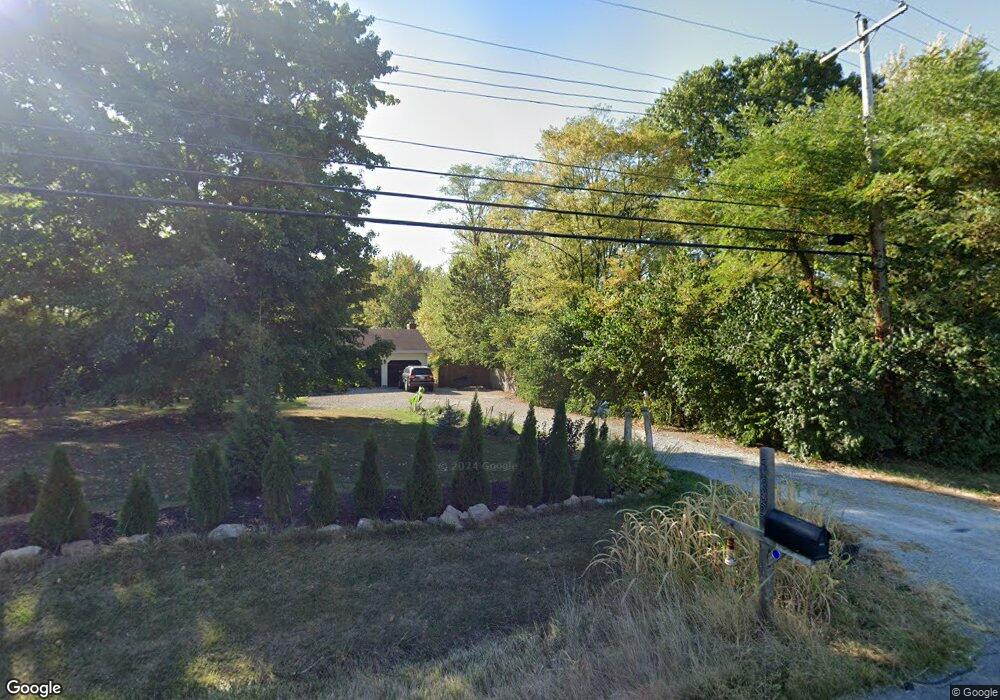
535 E Us Highway 22 and 3 Morrow, OH 45152
Hamilton Township NeighborhoodEstimated Value: $274,136 - $316,000
3
Beds
2
Baths
1,348
Sq Ft
$217/Sq Ft
Est. Value
About This Home
This home is located at 535 E Us Highway 22 and 3, Morrow, OH 45152 and is currently estimated at $292,784, approximately $217 per square foot. 535 E Us Highway 22 and 3 is a home located in Warren County with nearby schools including Little Miami High School.
Ownership History
Date
Name
Owned For
Owner Type
Purchase Details
Closed on
Apr 7, 2020
Sold by
Deeley Susan I and Mcglinn Joan F
Bought by
Fyre Victoria and Fenwick Gregory
Current Estimated Value
Home Financials for this Owner
Home Financials are based on the most recent Mortgage that was taken out on this home.
Original Mortgage
$186,558
Outstanding Balance
$164,637
Interest Rate
3.2%
Mortgage Type
FHA
Estimated Equity
$128,147
Purchase Details
Closed on
Apr 6, 2007
Sold by
Bowman Weatherly Russell and Weatherly Kalaine Lanette
Bought by
Deeley Susan I and Mcglinn Joan F
Home Financials for this Owner
Home Financials are based on the most recent Mortgage that was taken out on this home.
Original Mortgage
$157,600
Interest Rate
6.18%
Mortgage Type
Unknown
Purchase Details
Closed on
Aug 11, 1987
Sold by
Haynie James E and Haynie Shirley
Bought by
Weatherly and Russell Bowman
Purchase Details
Closed on
Jun 15, 1987
Sold by
Bitter Bitter and Bitter Stanton
Bought by
Haynie Haynie and Haynie James E
Create a Home Valuation Report for This Property
The Home Valuation Report is an in-depth analysis detailing your home's value as well as a comparison with similar homes in the area
Home Values in the Area
Average Home Value in this Area
Purchase History
| Date | Buyer | Sale Price | Title Company |
|---|---|---|---|
| Fyre Victoria | $190,000 | Prodigy Title Agency | |
| Deeley Susan I | $165,900 | None Available | |
| Weatherly | $13,500 | -- | |
| Haynie Haynie | $21,500 | -- |
Source: Public Records
Mortgage History
| Date | Status | Borrower | Loan Amount |
|---|---|---|---|
| Open | Fyre Victoria | $186,558 | |
| Previous Owner | Deeley Susan I | $157,600 |
Source: Public Records
Tax History Compared to Growth
Tax History
| Year | Tax Paid | Tax Assessment Tax Assessment Total Assessment is a certain percentage of the fair market value that is determined by local assessors to be the total taxable value of land and additions on the property. | Land | Improvement |
|---|---|---|---|---|
| 2024 | $2,972 | $66,910 | $18,380 | $48,530 |
| 2023 | $2,681 | $53,851 | $10,762 | $43,088 |
| 2022 | $2,649 | $53,851 | $10,763 | $43,089 |
| 2021 | $2,525 | $53,851 | $10,763 | $43,089 |
| 2020 | $2,405 | $43,782 | $8,750 | $35,032 |
| 2019 | $2,445 | $43,782 | $8,750 | $35,032 |
| 2018 | $2,385 | $43,782 | $8,750 | $35,032 |
| 2017 | $1,932 | $35,483 | $7,207 | $28,277 |
| 2016 | $1,979 | $35,483 | $7,207 | $28,277 |
| 2015 | $1,977 | $35,483 | $7,207 | $28,277 |
| 2014 | $2,092 | $33,160 | $6,730 | $26,430 |
| 2013 | $2,047 | $43,090 | $8,750 | $34,340 |
Source: Public Records
Map
Nearby Homes
- 668 Thornton Dr
- 619 Crabapple Ct
- 792 Oak Forest Dr
- 6076 Driftwood Ct
- 5708 Cochran Rd
- 161 Arbor Glen Ct
- 6107 Driftwood Ct
- 5672 Wyntree Ct
- 6583 West Rd
- 6203 Silver Wood Dr
- 5717 Pepperridge Ct
- 678 Emerald Dr
- 6250 Avebury Ct
- 261 Forest Edge Dr
- 5481 Windsor Ct
- 5255 Red Flower Ln
- 721 Kingly Terrace
- 209 Indian Lake Dr
- 809 Emerald Dr
- 0 Deere Run Ln Unit 1836428
- 535 E Us Highway 22 and 3
- 6135 Winding Way
- 535 U S 22
- 535 Us Rt 22 & 3
- 535 St Rt 22 & 3
- 563 E Us Highway 22 and 3
- 6136 Winding Way
- 6154 Winding Way
- 6163 Winding Way
- 6172 Winding Way
- 475 E Us Highway 22 and 3
- 475 U S 22
- 475 U S 22
- 475 Us Route 22
- 475 Us Route 22 & 3
- 475 Route 22 & 3
- 475 Us Rt 22 & 3
- 6182 Winding Way
- 475 Us-22
- 6195 Winding Way