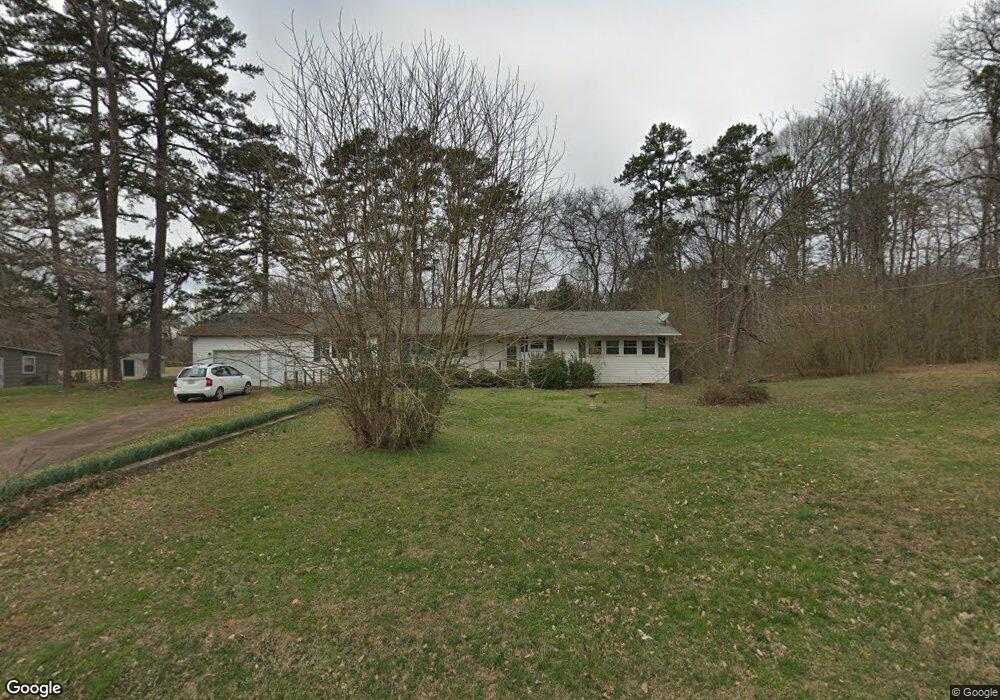
535 Highland View Dr Knoxville, TN 37920
Estimated Value: $245,000 - $342,000
4
Beds
2
Baths
1,400
Sq Ft
$225/Sq Ft
Est. Value
About This Home
This home is located at 535 Highland View Dr, Knoxville, TN 37920 and is currently estimated at $315,202, approximately $225 per square foot. 535 Highland View Dr is a home located in Knox County with nearby schools including New Hopewell Elementary School, South Doyle Middle School, and South Doyle High School.
Ownership History
Date
Name
Owned For
Owner Type
Purchase Details
Closed on
Jan 5, 2009
Sold by
Deutsche Bank National Trust Company
Bought by
Belcher Glenda J
Current Estimated Value
Home Financials for this Owner
Home Financials are based on the most recent Mortgage that was taken out on this home.
Original Mortgage
$67,100
Outstanding Balance
$42,792
Interest Rate
5.43%
Mortgage Type
Purchase Money Mortgage
Estimated Equity
$272,410
Purchase Details
Closed on
Jul 9, 2008
Sold by
Letsinger Glen C and Letsinger Pamela
Bought by
Deutsche Bank National Trust Co and The Registered Holders Of Argent Securit
Purchase Details
Closed on
Sep 2, 2005
Sold by
Meredith Ray G and Meredith Letha
Bought by
Letsinger Glen C and Letsinger Pamela
Home Financials for this Owner
Home Financials are based on the most recent Mortgage that was taken out on this home.
Original Mortgage
$119,250
Interest Rate
8.85%
Mortgage Type
Fannie Mae Freddie Mac
Create a Home Valuation Report for This Property
The Home Valuation Report is an in-depth analysis detailing your home's value as well as a comparison with similar homes in the area
Home Values in the Area
Average Home Value in this Area
Purchase History
| Date | Buyer | Sale Price | Title Company |
|---|---|---|---|
| Belcher Glenda J | $83,900 | Southeast Title & Escrow Llc | |
| Deutsche Bank National Trust Co | $138,789 | None Available | |
| Letsinger Glen C | $159,000 | -- |
Source: Public Records
Mortgage History
| Date | Status | Borrower | Loan Amount |
|---|---|---|---|
| Open | Belcher Glenda J | $67,100 | |
| Previous Owner | Letsinger Glen C | $119,250 |
Source: Public Records
Tax History Compared to Growth
Tax History
| Year | Tax Paid | Tax Assessment Tax Assessment Total Assessment is a certain percentage of the fair market value that is determined by local assessors to be the total taxable value of land and additions on the property. | Land | Improvement |
|---|---|---|---|---|
| 2025 | $554 | $47,050 | $0 | $0 |
| 2024 | $554 | $47,050 | $0 | $0 |
| 2023 | $554 | $47,050 | $0 | $0 |
| 2022 | $731 | $47,050 | $0 | $0 |
| 2021 | $554 | $26,125 | $0 | $0 |
| 2020 | $554 | $26,125 | $0 | $0 |
| 2019 | $554 | $26,125 | $0 | $0 |
| 2018 | $554 | $26,125 | $0 | $0 |
| 2017 | $554 | $26,125 | $0 | $0 |
| 2016 | $513 | $0 | $0 | $0 |
| 2015 | $513 | $0 | $0 | $0 |
| 2014 | $513 | $0 | $0 | $0 |
Source: Public Records
Map
Nearby Homes
- 511 Highland View Dr
- 524 Highland View Dr
- 548 Robotic Ln
- 549 Robotic Ln
- 500 Hayley Marie Ln
- 418 Hayley Marie Ln
- 368 Hayley Marie Ln
- 8606 Leeanna Brooke Ln
- 412 Bowers Park Cir
- 517 Bowers Park Cir
- 8829 W Simpson Rd
- 8109 Jonesboro Dr
- 727 Ic King Rd
- 318 Extine Ln
- 9115 Chapman Hwy Unit A
- 8823 Chapman Trace Way
- 8825 Chapman Trace Way
- 8827 Chapman Trace Way
- 217 Whites School Rd
- 8845 Chapman Trace Way
- 533 Highland View Dr
- 537 Highland View Dr
- 515 Highland View Dr
- 527 Highland View Dr
- 541 Highland View Dr
- 513 Highland View Dr
- 532 Highland View Dr
- 528 Highland View Dr
- 536 Highland View Dr
- 605 Highland View Dr
- 540 Highland View Dr
- 520 Highland View Dr
- 544 Highland View Dr
- 509 Highland View Dr
- 516 Highland View Dr
- 533 Ensley Dr
- 609 Highland View Dr
- 611 Highland View Dr
- 529 Ensley Dr Unit 2
- 601 Ensley Dr