
535 Pointe South Dr Savannah, GA 31410
3
Beds
2
Baths
1,370
Sq Ft
6,098
Sq Ft Lot
Highlights
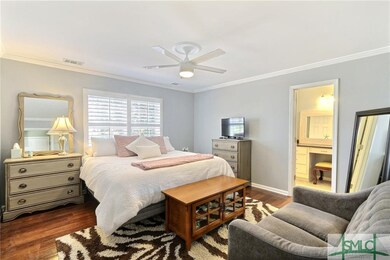
- Primary Bedroom Suite
- Private Yard
- Breakfast Bar
- Traditional Architecture
- 2 Car Attached Garage
- Laundry Room
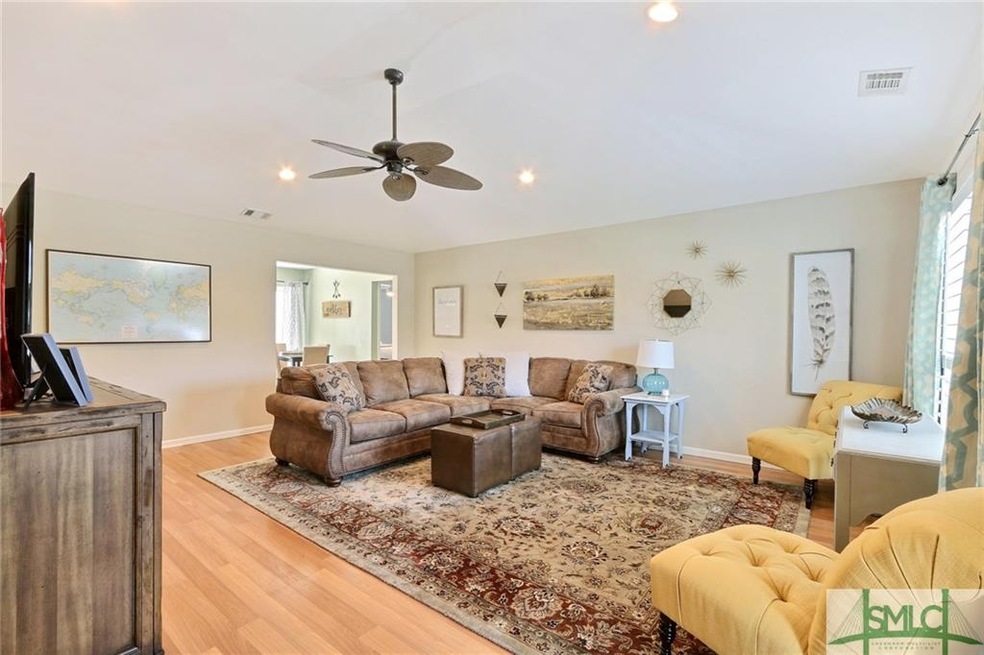
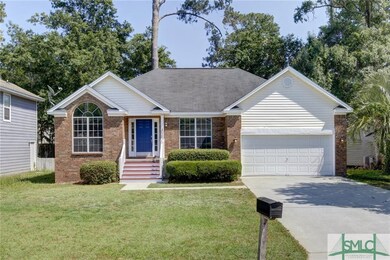
About This Home
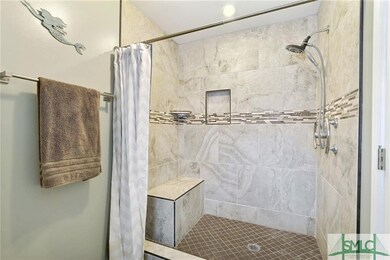
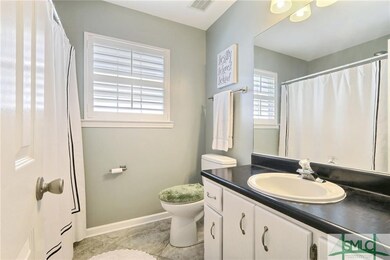
As of August 2018Prime Wilmington Island location! Beautifully maintained family home with great curb appeal. Updated with new lighting, smooth ceilings, wood floors in the living areas, split floor plan with spacious master also with wood floors, walk-in closet, and renovated master shower. Plantation shutters throughout and washer/dryer included!! Privacy fenced in backyard with a 2 car garage.
Last Agent to Sell the Property
Realty One Group Inclusion License #361269 Listed on: 05/09/2018
Home Details
Home Type
- Single Family
Est. Annual Taxes
- $2,812
Year Built
- Built in 1999 | Remodeled
Lot Details
- 6,098 Sq Ft Lot
- Private Yard
Home Design
- Traditional Architecture
- Brick Exterior Construction
- Raised Foundation
- Asphalt Roof
Interior Spaces
- 1,370 Sq Ft Home
- 1-Story Property
- Pull Down Stairs to Attic
- Laundry Room
Kitchen
- Breakfast Bar
- Convection Oven
- Dishwasher
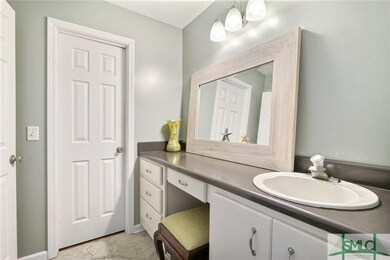
Bedrooms and Bathrooms
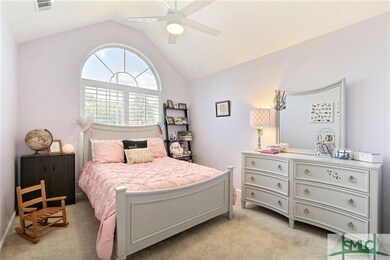
- 3 Bedrooms
- Primary Bedroom Suite
- 2 Full Bathrooms
Parking
- 2 Car Attached Garage
- Automatic Garage Door Opener
Utilities
- Central Heating and Cooling System
- Electric Water Heater
- Cable TV Available
Listing and Financial Details
- Home warranty included in the sale of the property
- Assessor Parcel Number 1-0037-01-049
Ownership History
Date
Name
Owned For
Owner Type
Purchase Details
Listed on
May 9, 2018
Closed on
Aug 24, 2018
Sold by
Cutrer Amanda Baran
Bought by
Vickers Michael and Vickers Sharon K
Seller's Agent
AnnMarie Neill
Realty One Group Inclusion
Buyer's Agent
Vanessa Barger
ERA Southeast Coastal
List Price
$237,000
Sold Price
$232,700
Premium/Discount to List
-$4,300
-1.81%
Current Estimated Value
Home Financials for this Owner
Home Financials are based on the most recent Mortgage that was taken out on this home.
Estimated Appreciation
$184,506
Avg. Annual Appreciation
8.66%
Original Mortgage
$237,703
Interest Rate
4.5%
Mortgage Type
Stand Alone Refi Refinance Of Original Loan
Purchase Details
Listed on
Sep 6, 2016
Closed on
Oct 21, 2016
Sold by
Joseph T
Bought by
Cutrer Amanda Baran and Baran Katie
Seller's Agent
Stephanie Wilson-Evans
Corcoran Austin Hill Realty
Buyer's Agent
Nonmls Sale
NON MLS MEMBER
List Price
$219,000
Sold Price
$215,000
Premium/Discount to List
-$4,000
-1.83%
Home Financials for this Owner
Home Financials are based on the most recent Mortgage that was taken out on this home.
Avg. Annual Appreciation
4.39%
Purchase Details
Listed on
May 6, 2013
Closed on
Jun 18, 2013
Sold by
Crouch Jeffrey M
Bought by
Evans Joseph T and Evans Barbara W
Seller's Agent
Robin Boaen
Keller Williams Coastal Area P
Buyer's Agent
Stephanie Wilson-Evans
Corcoran Austin Hill Realty
List Price
$184,900
Sold Price
$181,000
Premium/Discount to List
-$3,900
-2.11%
Home Financials for this Owner
Home Financials are based on the most recent Mortgage that was taken out on this home.
Avg. Annual Appreciation
5.27%
Original Mortgage
$131,000
Interest Rate
3.59%
Mortgage Type
New Conventional
Purchase Details
Closed on
Dec 15, 2008
Sold by
Not Provided
Bought by
Crouch Jeffrey M and Crouch Allison L
Home Financials for this Owner
Home Financials are based on the most recent Mortgage that was taken out on this home.
Original Mortgage
$177,655
Interest Rate
6.1%
Mortgage Type
FHA
Similar Homes in Savannah, GA
Create a Home Valuation Report for This Property
The Home Valuation Report is an in-depth analysis detailing your home's value as well as a comparison with similar homes in the area
Home Values in the Area
Average Home Value in this Area
Purchase History
| Date | Type | Sale Price | Title Company |
|---|---|---|---|
| Warranty Deed | $232,700 | -- | |
| Warranty Deed | $215,000 | -- | |
| Warranty Deed | $181,000 | -- | |
| Deed | $180,000 | -- |
Source: Public Records
Mortgage History
| Date | Status | Loan Amount | Loan Type |
|---|---|---|---|
| Open | $232,655 | VA | |
| Closed | $237,703 | Stand Alone Refi Refinance Of Original Loan | |
| Previous Owner | $131,000 | New Conventional | |
| Previous Owner | $177,655 | FHA |
Source: Public Records
Property History
| Date | Event | Price | Change | Sq Ft Price |
|---|---|---|---|---|
| 08/24/2018 08/24/18 | Sold | $232,700 | -1.0% | $170 / Sq Ft |
| 08/15/2018 08/15/18 | Pending | -- | -- | -- |
| 07/09/2018 07/09/18 | Price Changed | $235,000 | -0.8% | $172 / Sq Ft |
| 05/09/2018 05/09/18 | For Sale | $237,000 | +10.2% | $173 / Sq Ft |
| 10/21/2016 10/21/16 | Sold | $215,000 | -1.8% | $157 / Sq Ft |
| 09/06/2016 09/06/16 | Pending | -- | -- | -- |
| 09/06/2016 09/06/16 | For Sale | $219,000 | 0.0% | $160 / Sq Ft |
| 09/30/2015 09/30/15 | Rented | $2,000 | +25.0% | -- |
| 08/31/2015 08/31/15 | Under Contract | -- | -- | -- |
| 08/05/2014 08/05/14 | Rented | $1,600 | 0.0% | -- |
| 08/05/2014 08/05/14 | Under Contract | -- | -- | -- |
| 07/25/2014 07/25/14 | For Rent | $1,600 | -11.1% | -- |
| 02/11/2014 02/11/14 | For Rent | $1,800 | 0.0% | -- |
| 06/18/2013 06/18/13 | Sold | $181,000 | -2.1% | $132 / Sq Ft |
| 06/08/2013 06/08/13 | Pending | -- | -- | -- |
| 05/06/2013 05/06/13 | For Sale | $184,900 | -- | $135 / Sq Ft |
Source: Savannah Multi-List Corporation
Tax History Compared to Growth
Tax History
| Year | Tax Paid | Tax Assessment Tax Assessment Total Assessment is a certain percentage of the fair market value that is determined by local assessors to be the total taxable value of land and additions on the property. | Land | Improvement |
|---|---|---|---|---|
| 2024 | $7,516 | $172,240 | $32,000 | $140,240 |
| 2023 | $4,377 | $126,560 | $24,000 | $102,560 |
| 2022 | $3,540 | $113,520 | $18,000 | $95,520 |
| 2021 | $3,657 | $99,360 | $18,000 | $81,360 |
| 2020 | $3,396 | $96,960 | $18,000 | $78,960 |
| 2019 | $3,507 | $93,080 | $17,778 | $75,302 |
| 2018 | $2,675 | $84,840 | $18,000 | $66,840 |
| 2017 | $2,812 | $76,120 | $18,000 | $58,120 |
| 2016 | $2,447 | $71,400 | $18,000 | $53,400 |
| 2015 | $2,475 | $72,120 | $18,000 | $54,120 |
| 2014 | $3,725 | $72,400 | $0 | $0 |
Source: Public Records
Agents Affiliated with this Home
-
AnnMarie Neill
Seller's Agent in 2018
AnnMarie Neill
Realty One Group Inclusion
(912) 713-4630
41 in this area
111 Total Sales
-
Vanessa Barger
Buyer's Agent in 2018
Vanessa Barger
ERA Southeast Coastal
(912) 663-5782
54 in this area
193 Total Sales
-
Stephanie Wilson-Evans
Seller's Agent in 2016
Stephanie Wilson-Evans
Corcoran Austin Hill Realty
(912) 272-0010
4 in this area
19 Total Sales
-
Cliff Murse
Seller Co-Listing Agent in 2016
Cliff Murse
Cliff Murse Realty, LLC
(205) 706-6863
2 in this area
41 Total Sales
-
Nonmls Sale
N
Buyer's Agent in 2016
Nonmls Sale
NON MLS MEMBER
(912) 790-0023
19 in this area
4,076 Total Sales
-
Robin Boaen
Seller's Agent in 2013
Robin Boaen
Keller Williams Coastal Area P
(912) 272-3826
13 in this area
144 Total Sales
Map
Source: Savannah Multi-List Corporation
MLS Number: 190031
APN: 1003701049
Disclaimer: Certain information contained herein is derived from information provided by parties other than Homes.com. All information provided is deemed reliable, but is not guaranteed to be accurate and should be independently verified.
![]() IDX information is provided exclusively for personal, non-commercial use, and may not be used for any purpose other than to identify prospective properties consumers may be interested in purchasing.
IDX information is provided exclusively for personal, non-commercial use, and may not be used for any purpose other than to identify prospective properties consumers may be interested in purchasing.
Information is deemed reliable but not guaranteed.
Nearby Homes
- 539 Pointe Dr S
- 134 Sweet Bailey Cove
- 560 Oemler Loop
- 517 Pointe Dr S
- 511 Pointe Dr N
- 419 Walthour Rd
- 14 Palmetto Bay Rd
- 15 Sapphire Island Rd
- 625 Whippoorwill Rd
- 98 Picket Row
- 109 Runner Rd
- 108 Runner Rd
- 110 Runner Rd
- 908 Betz Creek Rd
- 2 Brittlewood Ct
- 106 Natalie Ct
- 141 Runner Rd
- 134 Peters Quay
- 3 Black Forest Dr
- 4 Highwater Ct