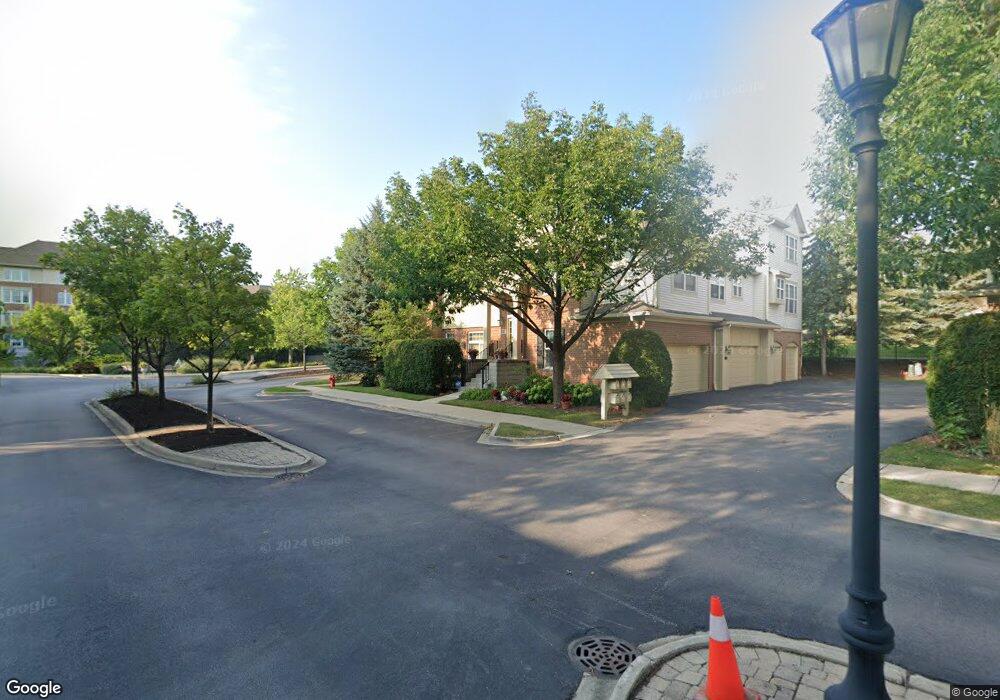
535 S Commons Ct Unit S Deerfield, IL 60015
Estimated Value: $456,762 - $528,000
2
Beds
2
Baths
1,719
Sq Ft
$281/Sq Ft
Est. Value
About This Home
This home is located at 535 S Commons Ct Unit S, Deerfield, IL 60015 and is currently estimated at $483,691, approximately $281 per square foot. 535 S Commons Ct Unit S is a home located in Lake County with nearby schools including South Park Elementary School, Charles J Caruso Middle School, and Deerfield High School.
Ownership History
Date
Name
Owned For
Owner Type
Purchase Details
Closed on
Jan 24, 2006
Sold by
Standard Bank & Trust Co
Bought by
Kalogeros Koula
Current Estimated Value
Purchase Details
Closed on
Jun 30, 2005
Sold by
Arenberg David J and Arenberg Beth A
Bought by
Standard Bank & Trust Co and Trust #18860
Home Financials for this Owner
Home Financials are based on the most recent Mortgage that was taken out on this home.
Original Mortgage
$343,200
Interest Rate
5.69%
Mortgage Type
Purchase Money Mortgage
Purchase Details
Closed on
Apr 30, 2001
Sold by
South Commons Venture
Bought by
Arenberg David J and Arenberg Beth A
Home Financials for this Owner
Home Financials are based on the most recent Mortgage that was taken out on this home.
Original Mortgage
$266,200
Interest Rate
7.02%
Mortgage Type
Purchase Money Mortgage
Create a Home Valuation Report for This Property
The Home Valuation Report is an in-depth analysis detailing your home's value as well as a comparison with similar homes in the area
Home Values in the Area
Average Home Value in this Area
Purchase History
| Date | Buyer | Sale Price | Title Company |
|---|---|---|---|
| Kalogeros Koula | -- | Attorneys Title Guaranty Fun | |
| Standard Bank & Trust Co | $429,000 | Attorneys Title Guaranty Fun | |
| Arenberg David J | $333,000 | -- |
Source: Public Records
Mortgage History
| Date | Status | Borrower | Loan Amount |
|---|---|---|---|
| Previous Owner | Standard Bank & Trust Co | $343,200 | |
| Previous Owner | Arenberg David J | $266,200 |
Source: Public Records
Tax History Compared to Growth
Tax History
| Year | Tax Paid | Tax Assessment Tax Assessment Total Assessment is a certain percentage of the fair market value that is determined by local assessors to be the total taxable value of land and additions on the property. | Land | Improvement |
|---|---|---|---|---|
| 2024 | $10,041 | $119,534 | $17,026 | $102,508 |
| 2023 | $11,149 | $114,716 | $16,340 | $98,376 |
| 2022 | $11,149 | $123,707 | $13,549 | $110,158 |
| 2021 | $10,511 | $119,270 | $13,063 | $106,207 |
| 2020 | $10,110 | $119,521 | $13,090 | $106,431 |
| 2019 | $9,880 | $119,318 | $13,068 | $106,250 |
| 2018 | $4,378 | $104,275 | $13,851 | $90,424 |
| 2017 | $8,156 | $103,943 | $13,807 | $90,136 |
| 2016 | $7,923 | $100,013 | $13,285 | $86,728 |
| 2015 | $7,749 | $93,970 | $12,482 | $81,488 |
| 2014 | $7,827 | $91,097 | $12,572 | $78,525 |
| 2012 | $7,426 | $90,293 | $12,461 | $77,832 |
Source: Public Records
Map
Nearby Homes
- 610 Robert York Ave Unit 104
- 441 Elm St Unit 3A
- 679 Central Ave
- 956 Brookside Ln
- 630 Hermitage Dr
- 1009 Central Ave
- 372 Kelburn Rd Unit 313
- 382 Kelburn Rd Unit 122
- 1038 Brookside Ln
- 361 Kelburn Rd Unit 316
- 745 Price Ln
- 757 Kipling Place
- 904 Forest Ave
- 312 Pine St
- 860 Kenton Rd
- 505 Margate Terrace
- 1103 Hazel Ave
- 677 Timber Hill Rd
- 934 Wayne Ave
- 717 Brierhill Rd
- 533 S Commons Ct Unit S
- 531 S Commons Ct Unit S
- 525 S Commons Ct
- 523 S Commons Ct
- 521 S Commons Ct
- 530 S Commons Ct Unit S
- 528 S Commons Ct Unit S
- 540 S Commons Ct
- 540 S Commons Ct Unit 540
- 540 S Commons Ct Unit S
- 542 S Commons Ct Unit 201-005
- 542 S Commons Ct Unit S
- 526 S Commons Ct Unit S
- 520 S Commons Ct Unit 202012
- 522 S Commons Ct Unit 202011
- 524 S Commons Ct Unit 202010
- 520 S Commons Ct Unit 202-01
- 520 S Commons Ct
- 544 S Commons Ct Unit 201-004
- 546 S Commons Ct Unit CT20100