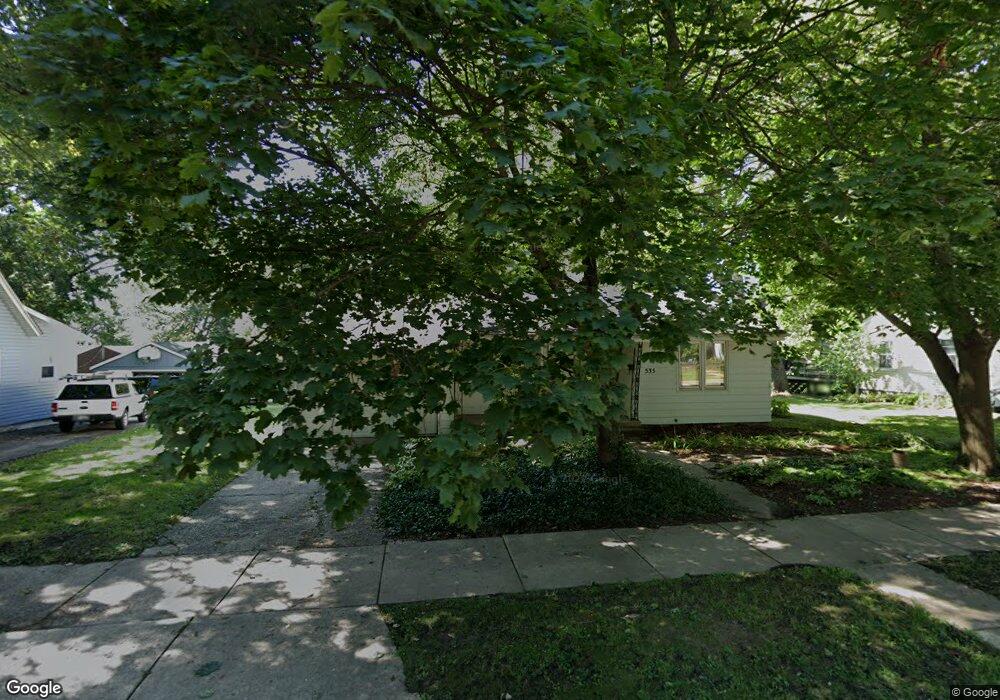
535 S Van Buren St Batavia, IL 60510
Southeast Batavia NeighborhoodEstimated Value: $247,000 - $279,000
2
Beds
2
Baths
832
Sq Ft
$314/Sq Ft
Est. Value
About This Home
This home is located at 535 S Van Buren St, Batavia, IL 60510 and is currently estimated at $261,561, approximately $314 per square foot. 535 S Van Buren St is a home located in Kane County with nearby schools including J B Nelson Elementary School, Sam Rotolo Middle School, and Batavia Sr High School.
Ownership History
Date
Name
Owned For
Owner Type
Purchase Details
Closed on
Aug 20, 2020
Sold by
Kmiec Eric V and Kmiec Marcey J
Bought by
Kmiec Eric V
Current Estimated Value
Purchase Details
Closed on
Mar 31, 2005
Sold by
Russell Ryan and Russell Shannon L
Bought by
Kmiec Eric and Kmiec Marcey J
Home Financials for this Owner
Home Financials are based on the most recent Mortgage that was taken out on this home.
Original Mortgage
$149,400
Outstanding Balance
$76,395
Interest Rate
5.64%
Mortgage Type
Purchase Money Mortgage
Estimated Equity
$185,166
Purchase Details
Closed on
Aug 31, 2001
Sold by
Bonds James Dale
Bought by
Russell Ryan and Russell Shannon L
Home Financials for this Owner
Home Financials are based on the most recent Mortgage that was taken out on this home.
Original Mortgage
$133,950
Interest Rate
7.03%
Mortgage Type
Balloon
Purchase Details
Closed on
Oct 27, 1994
Sold by
Capocasa Oma
Bought by
Capocasa Oma and Bonds James Dale
Create a Home Valuation Report for This Property
The Home Valuation Report is an in-depth analysis detailing your home's value as well as a comparison with similar homes in the area
Home Values in the Area
Average Home Value in this Area
Purchase History
| Date | Buyer | Sale Price | Title Company |
|---|---|---|---|
| Kmiec Eric V | -- | Attorney | |
| Kmiec Eric | $187,000 | Chicago Title Insurance Comp | |
| Russell Ryan | $141,000 | Chicago Title Insurance Co | |
| Capocasa Oma | -- | -- |
Source: Public Records
Mortgage History
| Date | Status | Borrower | Loan Amount |
|---|---|---|---|
| Open | Kmiec Eric | $149,400 | |
| Previous Owner | Russell Ryan | $133,950 |
Source: Public Records
Tax History Compared to Growth
Tax History
| Year | Tax Paid | Tax Assessment Tax Assessment Total Assessment is a certain percentage of the fair market value that is determined by local assessors to be the total taxable value of land and additions on the property. | Land | Improvement |
|---|---|---|---|---|
| 2024 | $5,422 | $76,578 | $43,739 | $32,839 |
| 2023 | $5,278 | $69,503 | $39,698 | $29,805 |
| 2022 | $5,148 | $64,956 | $37,101 | $27,855 |
| 2021 | $4,929 | $61,605 | $35,187 | $26,418 |
| 2020 | $4,803 | $60,421 | $34,511 | $25,910 |
| 2019 | $4,715 | $58,282 | $33,289 | $24,993 |
| 2018 | $4,517 | $56,062 | $32,021 | $24,041 |
| 2017 | $4,399 | $54,213 | $30,965 | $23,248 |
| 2016 | $4,297 | $52,634 | $30,063 | $22,571 |
| 2015 | -- | $51,810 | $35,827 | $15,983 |
| 2014 | -- | $50,179 | $34,699 | $15,480 |
| 2013 | -- | $57,705 | $42,527 | $15,178 |
Source: Public Records
Map
Nearby Homes
- 604 S Van Buren St
- 316 Locust St
- Lot 4 Manchester Ave
- 304 Manchester Ave
- 129 S Prairie St
- 860 S River St
- 445 Chillem Dr
- 509 S Forest Ave
- 621 Young Ave
- 941 Stanton St
- 404 S Batavia Ave
- 245 Stone Manor Cir
- 428 E Wilson St
- 1111 Hart Rd
- 424 State St
- 717 S Batavia Ave
- 345 Main St
- 330 First St
- 637 E Wilson St
- 426 Elm St
- 603 S Van Buren St
- 529 S Van Buren St
- 613 S Van Buren St Unit 2B
- 613 S Van Buren St Unit 6
- 613 S Van Buren St Unit 3
- 613 S Van Buren St Unit 2
- 613 S Van Buren St Unit 1
- 613 S Van Buren St Unit 3
- 613 S Van Buren St Unit 2
- 613 S Van Buren St Unit 1
- 523 S Van Buren St
- 532 S Van Buren St
- 522 S Van Buren St
- 515 S Van Buren St
- 612 S Van Buren St
- 528 S Van Buren St
- 621 S Van Buren St
- 317 Pine St
- 509 S Van Buren St
- 514 S Van Buren St