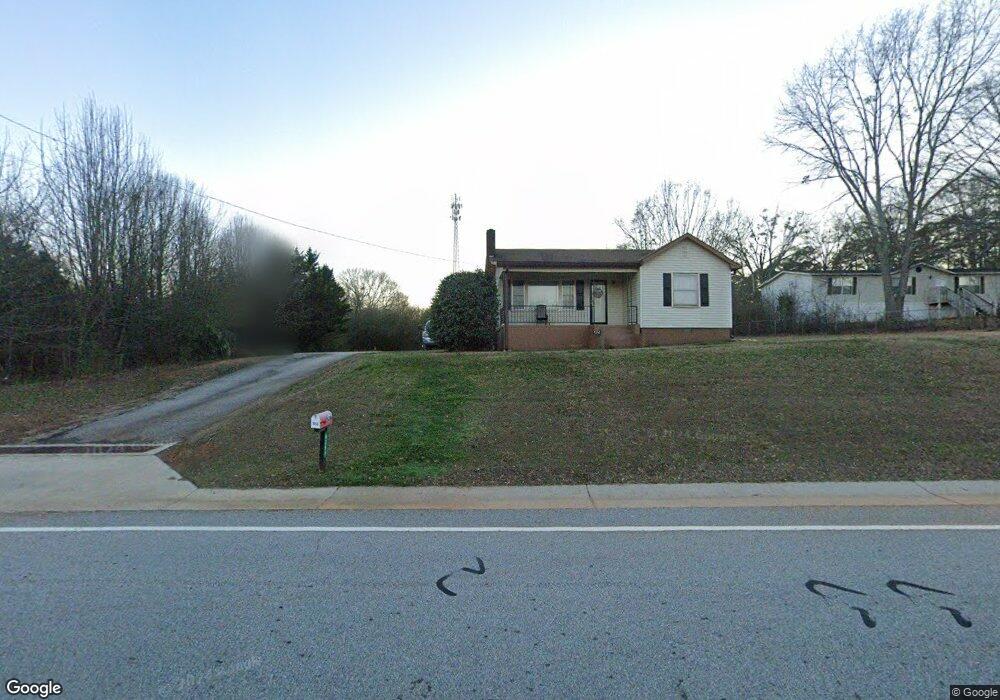
5350 Highway 17 Eastanollee, GA 30538
Estimated Value: $157,235 - $210,000
2
Beds
1
Bath
923
Sq Ft
$204/Sq Ft
Est. Value
About This Home
This home is located at 5350 Highway 17, Eastanollee, GA 30538 and is currently estimated at $188,559, approximately $204 per square foot. 5350 Highway 17 is a home located in Stephens County with nearby schools including Stephens County High School.
Ownership History
Date
Name
Owned For
Owner Type
Purchase Details
Closed on
Nov 2, 2022
Sold by
Whitfield Karissa
Bought by
Deitz Brett A
Current Estimated Value
Home Financials for this Owner
Home Financials are based on the most recent Mortgage that was taken out on this home.
Original Mortgage
$130,950
Outstanding Balance
$126,882
Interest Rate
6.94%
Mortgage Type
New Conventional
Estimated Equity
$61,677
Purchase Details
Closed on
May 8, 2019
Sold by
Slater Cindy Michelle
Bought by
Whitfield Karissa
Home Financials for this Owner
Home Financials are based on the most recent Mortgage that was taken out on this home.
Original Mortgage
$90,000
Interest Rate
4.1%
Mortgage Type
New Conventional
Purchase Details
Closed on
Oct 12, 2017
Sold by
Brown Timothy Leon
Bought by
Slater Cindy Michelle
Home Financials for this Owner
Home Financials are based on the most recent Mortgage that was taken out on this home.
Original Mortgage
$55,353
Interest Rate
3.78%
Mortgage Type
New Conventional
Purchase Details
Closed on
Jun 28, 2017
Sold by
Brown James Leon
Bought by
Brown Timothy Leon
Create a Home Valuation Report for This Property
The Home Valuation Report is an in-depth analysis detailing your home's value as well as a comparison with similar homes in the area
Home Values in the Area
Average Home Value in this Area
Purchase History
| Date | Buyer | Sale Price | Title Company |
|---|---|---|---|
| Deitz Brett A | $135,000 | -- | |
| Whitfield Karissa | $90,000 | -- | |
| Slater Cindy Michelle | $54,800 | -- | |
| Brown Timothy Leon | -- | -- |
Source: Public Records
Mortgage History
| Date | Status | Borrower | Loan Amount |
|---|---|---|---|
| Open | Deitz Brett A | $130,950 | |
| Previous Owner | Whitfield Karissa | $90,000 | |
| Previous Owner | Slater Cindy Michelle | $55,353 |
Source: Public Records
Tax History Compared to Growth
Tax History
| Year | Tax Paid | Tax Assessment Tax Assessment Total Assessment is a certain percentage of the fair market value that is determined by local assessors to be the total taxable value of land and additions on the property. | Land | Improvement |
|---|---|---|---|---|
| 2024 | $1,165 | $40,267 | $2,356 | $37,911 |
| 2023 | $1,060 | $37,622 | $2,356 | $35,266 |
| 2022 | $1,049 | $35,249 | $2,012 | $33,237 |
| 2021 | $1,024 | $32,756 | $2,012 | $30,744 |
| 2020 | $1,027 | $32,535 | $2,012 | $30,523 |
| 2019 | $820 | $27,853 | $2,396 | $25,457 |
| 2018 | $515 | $18,254 | $2,396 | $15,858 |
| 2017 | $0 | $18,254 | $2,396 | $15,858 |
| 2016 | $0 | $18,254 | $2,396 | $15,858 |
| 2015 | -- | $18,240 | $2,396 | $15,844 |
| 2014 | -- | $19,236 | $2,396 | $16,840 |
| 2013 | -- | $19,236 | $2,396 | $16,840 |
Source: Public Records
Map
Nearby Homes
- 290 Indian Dr
- 232 Oak Way Dr
- 160 Oak Way Dr
- 303 Oak Way Dr
- 7 Jottings Dr
- 17 Pinetree Rd
- 219 Eastanollee Rd
- 2657 Wolfpit Rd
- 672 Crawford Cir
- 56 Crawford Manor Dr
- 54 Stonewood Forest Rd
- 3953 Liberty Hill Rd
- 160 Buena Vista Dr
- 1520 Defoor Rd
- 3089 Georgia 17 Alternate
- 5.10 ACRES Hwy 123
- 3013 Hwy 17 A
- 3.35 ACRES Keener Rd
- 535 Deer Chase
- 151 Rock Creek Rd
- 4630 Georgia 17
- 5390 Highway 17
- 5290 Highway 17
- 795 Moore Cir
- 5474 Highway 17
- 5459 Highway 17
- 803 Moore Cir
- 0 Moore Cir Unit 7200234
- 0 Moore Cir Unit 3183058
- 0 Moore Cir Unit 8322993
- 549 Moore Cir
- 147 Stoney Farm Dr
- 4981 Highway 17
- 600 Moore Cir
- 668 Moore Cir
- 616 Moore Cir
- 90 North Ave
- 279 Cherokee Dr
- 254 Clary Extension
- 126 Cherokee Dr