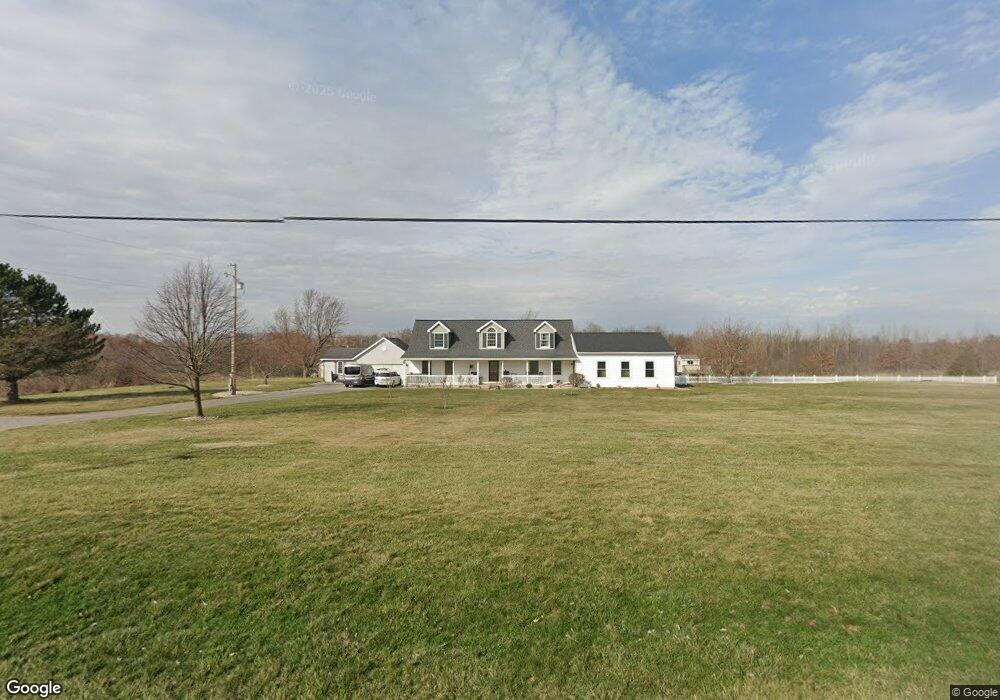
5350 Pevee Rd Bluffton, OH 45817
Estimated Value: $286,000 - $440,000
7
Beds
5
Baths
3,151
Sq Ft
$117/Sq Ft
Est. Value
About This Home
This home is located at 5350 Pevee Rd, Bluffton, OH 45817 and is currently estimated at $367,787, approximately $116 per square foot. 5350 Pevee Rd is a home located in Allen County with nearby schools including Allen East Elementary School, Allen East Middle School, and Allen East High School.
Ownership History
Date
Name
Owned For
Owner Type
Purchase Details
Closed on
Jan 6, 2017
Sold by
Harris Mary R and Harris Joep P
Bought by
Naylor Matthew J and Naylor Elizabeth S
Current Estimated Value
Home Financials for this Owner
Home Financials are based on the most recent Mortgage that was taken out on this home.
Original Mortgage
$192,375
Outstanding Balance
$156,555
Interest Rate
4.03%
Mortgage Type
New Conventional
Estimated Equity
$211,232
Purchase Details
Closed on
Aug 2, 2002
Sold by
Nestor Dennis R
Bought by
Nestor Mary R Koening Dennis R
Purchase Details
Closed on
Apr 20, 1999
Sold by
Est Jessie Whitaker
Bought by
Nestor Dennis Barbara
Home Financials for this Owner
Home Financials are based on the most recent Mortgage that was taken out on this home.
Original Mortgage
$41,325
Interest Rate
7.1%
Mortgage Type
New Conventional
Purchase Details
Closed on
Mar 23, 1992
Bought by
Whitaker Jessie
Create a Home Valuation Report for This Property
The Home Valuation Report is an in-depth analysis detailing your home's value as well as a comparison with similar homes in the area
Purchase History
| Date | Buyer | Sale Price | Title Company |
|---|---|---|---|
| Naylor Matthew J | $202,500 | None Available | |
| Nestor Mary R Koening Dennis R | $47,000 | -- | |
| Nestor Dennis Barbara | $43,500 | -- | |
| Whitaker Jessie | $30,000 | -- |
Source: Public Records
Mortgage History
| Date | Status | Borrower | Loan Amount |
|---|---|---|---|
| Open | Naylor Matthew J | $192,375 | |
| Previous Owner | Nestor Dennis Barbara | $41,325 |
Source: Public Records
Tax History
| Year | Tax Paid | Tax Assessment Tax Assessment Total Assessment is a certain percentage of the fair market value that is determined by local assessors to be the total taxable value of land and additions on the property. | Land | Improvement |
|---|---|---|---|---|
| 2024 | $4,591 | $134,300 | $13,790 | $120,510 |
| 2023 | $3,859 | $102,520 | $10,540 | $91,980 |
| 2022 | $3,409 | $89,820 | $10,540 | $79,280 |
| 2021 | $2,930 | $77,250 | $8,750 | $68,500 |
| 2020 | $2,469 | $63,290 | $8,160 | $55,130 |
| 2019 | $2,469 | $63,290 | $8,160 | $55,130 |
| 2018 | $2,361 | $63,290 | $8,160 | $55,130 |
| 2017 | $2,256 | $56,110 | $8,160 | $47,950 |
| 2016 | $2,247 | $56,110 | $8,160 | $47,950 |
| 2015 | $2,242 | $56,110 | $8,160 | $47,950 |
| 2014 | $2,204 | $53,310 | $7,740 | $45,570 |
| 2013 | $2,145 | $53,310 | $7,740 | $45,570 |
Source: Public Records
Map
Nearby Homes
- 3720 N Phillips Rd
- 7700 Mehaffey Rd
- 2327 N Phillips Rd
- 20515 County Road 15
- 6476 Mickelson Ln
- 5817 N Dixie Hwy
- 6477 Woods Dr Unit 220
- 6431 Couples Ln
- 5025 N Cool Rd
- 105 S Washington St
- 333 Parkview Dr
- 331 Parkview Dr
- 329 Parkview Dr
- 327 Parkview Dr
- 321 Parkview Dr
- 319 Parkview Dr
- 317 Parkview Dr
- 315 Parkview Dr
- 301 Parkview Dr
- 303 Parkview Dr
Your Personal Tour Guide
Ask me questions while you tour the home.