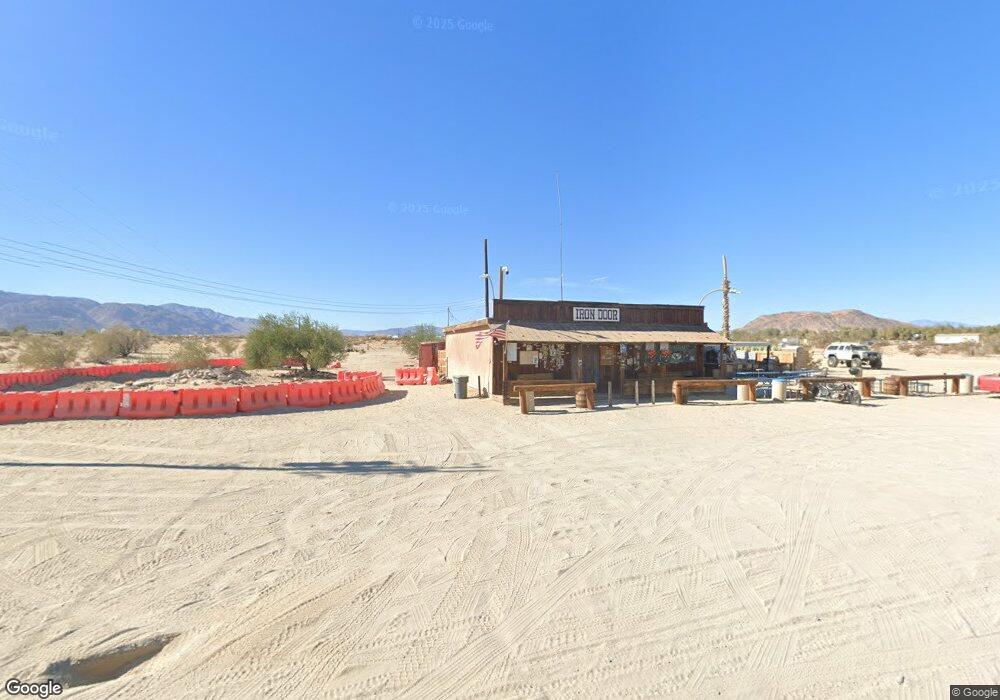
5350 Split Mountain Rd Borrego Springs, CA 92004
Estimated Value: $188,713 - $458,000
--
Bed
1
Bath
256
Sq Ft
$1,066/Sq Ft
Est. Value
About This Home
This home is located at 5350 Split Mountain Rd, Borrego Springs, CA 92004 and is currently estimated at $272,928, approximately $1,066 per square foot. 5350 Split Mountain Rd is a home located in San Diego County with nearby schools including Borrego Springs Elementary School, Borrego Springs Middle School, and Borrego Springs High School.
Ownership History
Date
Name
Owned For
Owner Type
Purchase Details
Closed on
Aug 5, 2025
Sold by
Henry E Pena Revocable Trust and Pena Henry E
Bought by
Henry E Pena Grantor Trust and Ingersoll
Current Estimated Value
Purchase Details
Closed on
Jul 22, 2003
Sold by
Pena Henry E
Bought by
Pena Henry E
Purchase Details
Closed on
Jul 31, 2002
Sold by
Irons Douglas Russell and Irons Karen Sunie
Bought by
Pena Henry E
Purchase Details
Closed on
Dec 30, 1994
Sold by
Yale Dean E
Bought by
Irons Douglas Russell and Irons Karen Sunie
Home Financials for this Owner
Home Financials are based on the most recent Mortgage that was taken out on this home.
Original Mortgage
$32,000
Interest Rate
9.27%
Mortgage Type
Seller Take Back
Purchase Details
Closed on
Oct 4, 1993
Sold by
Yale Joan A
Bought by
Yale Dean E
Create a Home Valuation Report for This Property
The Home Valuation Report is an in-depth analysis detailing your home's value as well as a comparison with similar homes in the area
Home Values in the Area
Average Home Value in this Area
Purchase History
| Date | Buyer | Sale Price | Title Company |
|---|---|---|---|
| Henry E Pena Grantor Trust | -- | None Listed On Document | |
| Pena Henry E | -- | -- | |
| Pena Henry E | -- | Gateway Title | |
| Irons Douglas Russell | $49,000 | Chicago Title Company | |
| Yale Dean E | $49,000 | Old Republic Title |
Source: Public Records
Mortgage History
| Date | Status | Borrower | Loan Amount |
|---|---|---|---|
| Previous Owner | Irons Douglas Russell | $32,000 |
Source: Public Records
Tax History Compared to Growth
Tax History
| Year | Tax Paid | Tax Assessment Tax Assessment Total Assessment is a certain percentage of the fair market value that is determined by local assessors to be the total taxable value of land and additions on the property. | Land | Improvement |
|---|---|---|---|---|
| 2025 | $544 | $57,924 | $36,203 | $21,721 |
| 2024 | $544 | $56,790 | $35,494 | $21,296 |
| 2023 | $530 | $55,678 | $34,799 | $20,879 |
| 2022 | $520 | $54,587 | $34,117 | $20,470 |
| 2021 | $472 | $50,000 | $30,000 | $20,000 |
| 2020 | $454 | $48,000 | $29,000 | $19,000 |
| 2019 | $409 | $46,000 | $28,000 | $18,000 |
| 2018 | $388 | $44,000 | $27,000 | $17,000 |
| 2017 | $367 | $42,000 | $26,000 | $16,000 |
| 2016 | $343 | $40,000 | $25,000 | $15,000 |
| 2015 | $343 | $40,000 | $25,000 | $15,000 |
| 2014 | $322 | $38,000 | $24,000 | $14,000 |
Source: Public Records
Map
Nearby Homes
- 0 Split Mountain Rd Unit 37
- 100 -400 AC Split Mountain Rd
- 5145 Highway 78 Unit 508
- 5145 Highway 78 Unit 709
- 5145 Highway 78 Unit 703
- 0 Old Kane Springs Rd Unit 4 240008654
- 5145 California 78 Unit 703
- 0 Town Center Christmas Cir Unit 250038541
- 0 11th St Unit 11 240008556
- 0 Broadway Unit 13 250000484
- 6455 1st St
- 7189 California 78
- 2789 Stinson Rd
- 0 Ocotillo Wells Unit 219132735DA
- 2626 Airstrip
- 4236 Connie Ln
- 2772 Stinson Rd Unit 20 and 21
- 0 Broadway Lot 3 Unit NDP2508603
- 3215 Roadrunner Dr S
- 2842 Fonts Point Dr
- 5937 Highway 78
- 1551 Highway 78
- 5348 Split Mountain Rd
- 5915 Highway 78
- 5360 Split Mountain Rd
- 5913 Highway 78
- 5372 Split Mountain Rd
- 5902 Kunkler Ln
- 5958 Kunkler Ln
- 0000 Kunkler
- 0 Kunkler Unit 86001410
- 00 Hwy 78
- 5997 Highway 78
- 5851 Highway 78
- 5353 Split Mountain Rd
- 0 Hwy 78 and Split Mountain Rd Unit 80051511
- 5855 Highway 78
- 5855 California 78
- 5754 California 78 Unit 709
- 5154 California 78 Unit 709