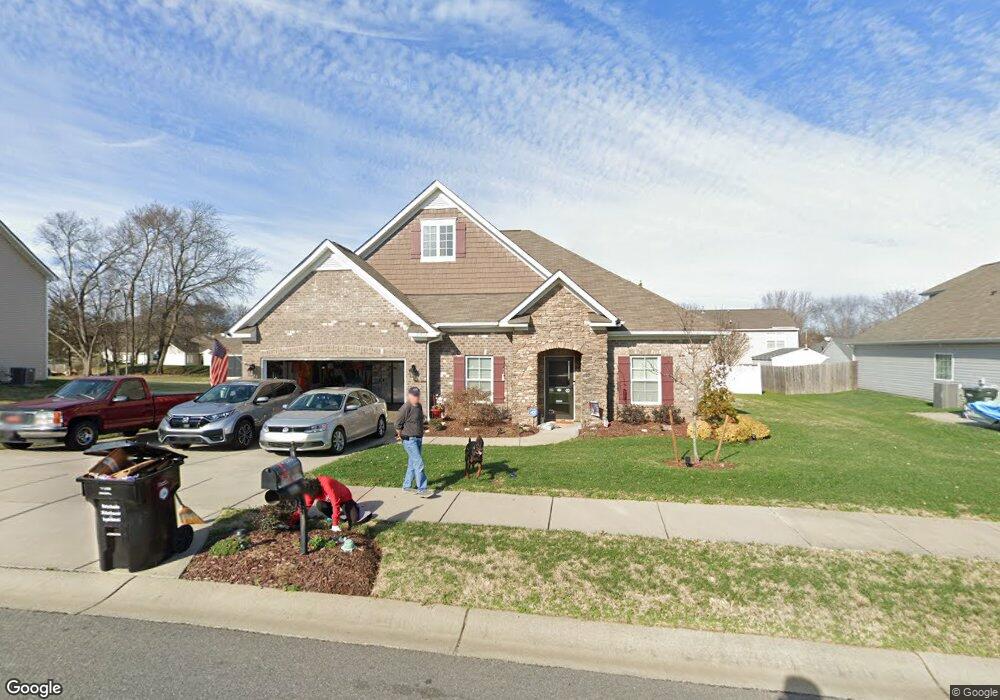
5351 Hackberry Ln SW Unit 37 Concord, NC 28027
Estimated Value: $485,000 - $491,000
3
Beds
3
Baths
2,464
Sq Ft
$198/Sq Ft
Est. Value
About This Home
This home is located at 5351 Hackberry Ln SW Unit 37, Concord, NC 28027 and is currently estimated at $487,767, approximately $197 per square foot. 5351 Hackberry Ln SW Unit 37 is a home located in Cabarrus County with nearby schools including Pitts School Road Elementary School, Roberta Road Middle School, and Jay M. Robinson High School.
Ownership History
Date
Name
Owned For
Owner Type
Purchase Details
Closed on
Apr 7, 2017
Sold by
Reiser David and Reiser Maria E
Bought by
Sturbeck Louis and Sturbeck Margaret A
Current Estimated Value
Home Financials for this Owner
Home Financials are based on the most recent Mortgage that was taken out on this home.
Original Mortgage
$105,000
Outstanding Balance
$87,256
Interest Rate
4.16%
Mortgage Type
New Conventional
Estimated Equity
$400,511
Purchase Details
Closed on
Mar 7, 2014
Sold by
The Ryland Group Inc
Bought by
Reiser David and Reiser Marie E
Home Financials for this Owner
Home Financials are based on the most recent Mortgage that was taken out on this home.
Original Mortgage
$184,000
Interest Rate
4.36%
Mortgage Type
New Conventional
Purchase Details
Closed on
Jul 1, 2012
Sold by
Timberstone Homes Inc
Bought by
Ryland Group Inc A Md Corp
Purchase Details
Closed on
Jan 1, 2012
Sold by
Goodman Richard L
Bought by
Timberstone Homes Inc
Create a Home Valuation Report for This Property
The Home Valuation Report is an in-depth analysis detailing your home's value as well as a comparison with similar homes in the area
Home Values in the Area
Average Home Value in this Area
Purchase History
| Date | Buyer | Sale Price | Title Company |
|---|---|---|---|
| Sturbeck Louis | $244,000 | None Available | |
| Reiser David | $230,000 | None Available | |
| Ryland Group Inc A Md Corp | $4,242,000 | -- | |
| Timberstone Homes Inc | $912,000 | -- |
Source: Public Records
Mortgage History
| Date | Status | Borrower | Loan Amount |
|---|---|---|---|
| Open | Sturbeck Louis | $105,000 | |
| Previous Owner | Reiser David | $184,000 |
Source: Public Records
Tax History Compared to Growth
Tax History
| Year | Tax Paid | Tax Assessment Tax Assessment Total Assessment is a certain percentage of the fair market value that is determined by local assessors to be the total taxable value of land and additions on the property. | Land | Improvement |
|---|---|---|---|---|
| 2025 | $4,713 | $473,210 | $120,000 | $353,210 |
| 2024 | $4,818 | $483,690 | $120,000 | $363,690 |
| 2023 | $3,253 | $266,650 | $55,000 | $211,650 |
| 2022 | $3,253 | $266,650 | $55,000 | $211,650 |
| 2021 | $3,253 | $266,650 | $55,000 | $211,650 |
| 2020 | $3,253 | $266,650 | $55,000 | $211,650 |
| 2019 | $2,849 | $233,500 | $30,000 | $203,500 |
| 2018 | $2,758 | $229,860 | $30,000 | $199,860 |
| 2017 | $2,712 | $229,860 | $30,000 | $199,860 |
| 2016 | $1,609 | $196,240 | $32,000 | $164,240 |
| 2015 | $378 | $77,310 | $32,000 | $45,310 |
| 2014 | $378 | $77,310 | $32,000 | $45,310 |
Source: Public Records
Map
Nearby Homes
- 4266 Barley St SW
- 4271 Millet St SW Unit 198
- 849 Treva Anne Dr SW
- 842 Treva Anne Dr SW
- 5361 Brickyard Terrace Ct
- 706 King Fredrick Ln SW
- 3254 Hawick Commons Dr
- 3907 Melissa Dr
- 4349 Roberta Rd
- 4114 Carolina Pointe Ct SW
- 4112 Alexis Ct SW
- 4333 Glen Eagles Ln SW
- 5366 Hardister Place
- 5899 Crimson Oak Ct
- 3950 Harrisburg Dr
- 3642 Waterloo Dr
- 3648 Waterloo Dr
- 3618 Waterloo Dr
- 4104 Pebblebrook Cir SW
- 6050 Roberta Rd
- 5351 Hackberry Ln SW Unit 20
- 5004 Wheat Dr SW
- 5347 Hackberry Ln SW
- 4996 Wheat Dr SW
- 5348 Hackberry Ln SW
- 4992 Wheat Dr SW
- 5359 Hackberry Ln SW
- 5354 Hackberry Ln SW
- 4988 Wheat Dr SW
- 5343 Hackberry Ln SW
- 5020 Wheat Dr SW
- 5340 Hackberry Ln SW
- 4984 Wheat Dr SW
- 5358 Hackberry Ln SW
- 5363 Hackberry Ln SW
- 5005 Wheat Dr SW
- 5362 Hackberry Ln SW Unit 14
- 5362 Hackberry Ln SW
- 4995 Wheat Dr SW
- 5028 Wheat Dr SW