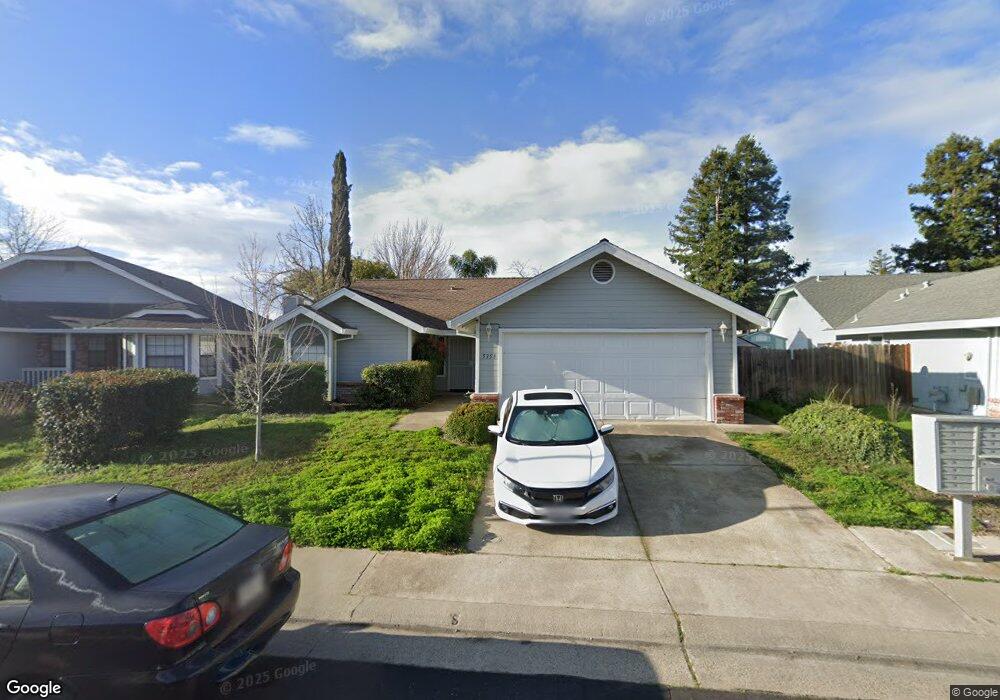
5351 Misty Meadow Way Elk Grove, CA 95758
North West Elk Grove NeighborhoodEstimated Value: $450,000 - $532,000
3
Beds
2
Baths
1,334
Sq Ft
$372/Sq Ft
Est. Value
About This Home
This home is located at 5351 Misty Meadow Way, Elk Grove, CA 95758 and is currently estimated at $496,904, approximately $372 per square foot. 5351 Misty Meadow Way is a home located in Sacramento County with nearby schools including Marion Mix Elementary School, Harriet G. Eddy Middle School, and Laguna Creek High School.
Ownership History
Date
Name
Owned For
Owner Type
Purchase Details
Closed on
Dec 12, 2017
Sold by
Boulos Melanie A and Boulos Mamdouh W
Bought by
Boulos Mamdouh and Boulos Melanie
Current Estimated Value
Purchase Details
Closed on
Mar 9, 2005
Sold by
Memmott Austin and Memmott Tanya
Bought by
Boulos Mamdouh W and Boulos Melanie A
Home Financials for this Owner
Home Financials are based on the most recent Mortgage that was taken out on this home.
Original Mortgage
$272,000
Outstanding Balance
$141,444
Interest Rate
6%
Mortgage Type
Purchase Money Mortgage
Estimated Equity
$355,460
Purchase Details
Closed on
May 29, 2002
Sold by
Va
Bought by
Memmott Austin and Memmott Tanya
Home Financials for this Owner
Home Financials are based on the most recent Mortgage that was taken out on this home.
Original Mortgage
$148,800
Interest Rate
6.89%
Create a Home Valuation Report for This Property
The Home Valuation Report is an in-depth analysis detailing your home's value as well as a comparison with similar homes in the area
Home Values in the Area
Average Home Value in this Area
Purchase History
| Date | Buyer | Sale Price | Title Company |
|---|---|---|---|
| Boulos Mamdouh | -- | None Available | |
| Boulos Mamdouh W | $340,000 | Alliance Title Company | |
| Memmott Austin | -- | Stewart Title |
Source: Public Records
Mortgage History
| Date | Status | Borrower | Loan Amount |
|---|---|---|---|
| Open | Boulos Mamdouh W | $272,000 | |
| Previous Owner | Memmott Austin | $148,800 | |
| Closed | Memmott Austin | $37,200 | |
| Closed | Boulos Mamdouh W | $33,950 |
Source: Public Records
Tax History Compared to Growth
Tax History
| Year | Tax Paid | Tax Assessment Tax Assessment Total Assessment is a certain percentage of the fair market value that is determined by local assessors to be the total taxable value of land and additions on the property. | Land | Improvement |
|---|---|---|---|---|
| 2025 | $5,417 | $473,910 | $195,139 | $278,771 |
| 2024 | $5,417 | $464,618 | $191,313 | $273,305 |
| 2023 | $5,270 | $455,509 | $187,562 | $267,947 |
| 2022 | $5,181 | $446,579 | $183,885 | $262,694 |
| 2021 | $5,094 | $437,824 | $180,280 | $257,544 |
| 2020 | $4,783 | $410,884 | $169,186 | $241,698 |
| 2019 | $4,493 | $384,004 | $158,118 | $225,886 |
| 2018 | $4,296 | $369,236 | $152,037 | $217,199 |
| 2017 | $4,036 | $345,081 | $142,091 | $202,990 |
| 2016 | $3,654 | $319,520 | $131,566 | $187,954 |
| 2015 | $3,337 | $290,474 | $119,606 | $170,868 |
| 2014 | $3,182 | $274,032 | $112,836 | $161,196 |
Source: Public Records
Map
Nearby Homes
- Residence 2125 Plan at Tegan Estates
- Residence 1845 Plan at Tegan Estates
- Residence 1960 Plan at Tegan Estates
- Residence 1850 Plan at Tegan Estates
- 5161 Saint Edwards Way
- 9105 Turnbull Ct
- 9121 Hensley Way
- 9139 Hensley Way
- 9144 Hensley Way
- 5013 Efthemia Way
- 9186 Jamel Ct
- 8959 Boreal Way
- 5201 Laguna Oaks Dr Unit 96
- 5201 Laguna Oaks Dr Unit 12
- 5201 Laguna Oaks Dr Unit 70
- 5201 Laguna Oaks Dr Unit 5
- 0 Elliott Ranch Rd Unit 225131105
- 8944 Warmsprings St
- 5817 Sparrow Hawk Ct
- 5400 Lawnview Way
- 5347 Misty Meadow Way
- 5355 Misty Meadow Way
- 9085 Hamatani Ct
- 9089 Hamatani Ct
- 5343 Misty Meadow Way
- 5052 Laguna Park Dr
- 5227 Misty Meadow Way
- 5350 Misty Meadow Way
- 5231 Misty Meadow Way
- 5048 Laguna Park Dr
- 5358 Misty Meadow Way
- 9080 Hamatani Ct
- 5344 Misty Meadow Way
- 5339 Misty Meadow Way
- 5235 Misty Meadow Way
- 9093 Hamatani Ct
- 9066 Weeping Fig Way
- 5102 Laguna Park Dr
- 5044 Laguna Park Dr
- 5239 Misty Meadow Way