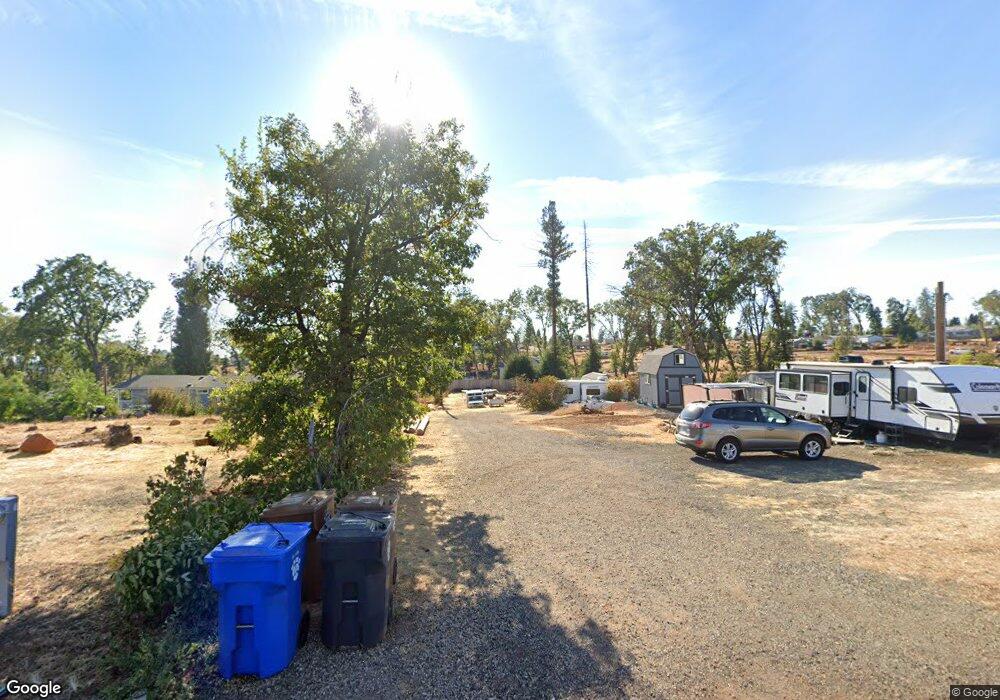
5351 Sawmill Rd Paradise, CA 95969
Estimated Value: $129,763 - $131,000
1
Bed
1
Bath
500
Sq Ft
$261/Sq Ft
Est. Value
About This Home
This home is located at 5351 Sawmill Rd, Paradise, CA 95969 and is currently estimated at $130,382, approximately $260 per square foot. 5351 Sawmill Rd is a home located in Butte County with nearby schools including Paradise Junior High School, Paradise Senior High School, and Paradise Christian School.
Ownership History
Date
Name
Owned For
Owner Type
Purchase Details
Closed on
Dec 9, 2013
Sold by
Brady Lee Ann
Bought by
Cranney Jeremy K
Current Estimated Value
Home Financials for this Owner
Home Financials are based on the most recent Mortgage that was taken out on this home.
Original Mortgage
$17,000
Outstanding Balance
$12,621
Interest Rate
4.04%
Mortgage Type
Seller Take Back
Estimated Equity
$117,761
Purchase Details
Closed on
Oct 7, 2013
Sold by
Burton Teresa C
Bought by
Brady Lee Ann
Purchase Details
Closed on
Jul 10, 2007
Sold by
Brady Lee Ann
Bought by
Burton Teresa C
Home Financials for this Owner
Home Financials are based on the most recent Mortgage that was taken out on this home.
Original Mortgage
$75,000
Interest Rate
6.51%
Mortgage Type
Seller Take Back
Purchase Details
Closed on
Jan 13, 2003
Sold by
Datus Scott Dean and Datus Michelle Louise
Bought by
Brady Lee Ann
Create a Home Valuation Report for This Property
The Home Valuation Report is an in-depth analysis detailing your home's value as well as a comparison with similar homes in the area
Home Values in the Area
Average Home Value in this Area
Purchase History
| Date | Buyer | Sale Price | Title Company |
|---|---|---|---|
| Cranney Jeremy K | $25,000 | Mid Valley Title & Escrow Co | |
| Brady Lee Ann | $71,012 | Mid Valley Title & Escrow Co | |
| Burton Teresa C | $85,000 | Mid Valley Title & Escrow Co | |
| Brady Lee Ann | $83,000 | Mid Valley Title Co |
Source: Public Records
Mortgage History
| Date | Status | Borrower | Loan Amount |
|---|---|---|---|
| Open | Cranney Jeremy K | $17,000 | |
| Previous Owner | Burton Teresa C | $75,000 |
Source: Public Records
Tax History Compared to Growth
Tax History
| Year | Tax Paid | Tax Assessment Tax Assessment Total Assessment is a certain percentage of the fair market value that is determined by local assessors to be the total taxable value of land and additions on the property. | Land | Improvement |
|---|---|---|---|---|
| 2025 | $948 | $30,641 | $30,641 | -- |
| 2024 | $948 | $30,041 | $30,041 | $0 |
| 2023 | $369 | $29,452 | $29,452 | $0 |
| 2022 | $802 | $28,875 | $28,875 | $0 |
| 2021 | $355 | $28,309 | $28,309 | $0 |
| 2020 | $340 | $28,019 | $28,019 | $0 |
| 2019 | $334 | $27,470 | $27,470 | $0 |
| 2018 | $388 | $32,316 | $26,932 | $5,384 |
| 2017 | $382 | $31,683 | $26,404 | $5,279 |
| 2016 | $374 | $31,063 | $25,887 | $5,176 |
| 2015 | -- | $30,598 | $25,499 | $5,099 |
| 2014 | -- | $30,000 | $25,000 | $5,000 |
Source: Public Records
Map
Nearby Homes
- 1436 Wolf Ln
- 5415 Sawmill Rd
- 1461 Carroll Ln
- 5376 S Libby Rd
- 1431 Carroll Ln
- 1422 W Dottie Ln
- 1397 Keller Ln
- 5442 S Libby Rd
- 1438 Toni Dr
- 5427 Edgewood Ln Unit 3
- 1557 La Grande Vue
- 5428 T J Way
- 1575 La Grand View Rd
- 1429 Bennett Rd
- 1433 Bennett Rd
- 5485 S Libby Rd
- 5500 Sawmill Rd
- 1610 Jaramillo Ln
- 0 Circle Ln
- 5298 Edgewood Ln
- 5353 Sawmill Rd
- 5361 Sawmill Rd
- 5349 Sawmill Rd
- 1489 Magadon Rd
- 1474 Leafy Ln
- 1495 Leafy Ln
- 5371 Sawmill Rd
- 1492 Magadon Rd
- 1473 Leafy Ln
- 5366 Sawmill Rd
- 5333 Sawmill Rd
- 1458 Leafy Ln
- 1486 Magadon Rd
- 1515 Big Pine Ln
- 1457 Leafy Ln
- 5326 Sawmill Rd
- 5382 Sawmill Rd
- 5321 Sawmill Rd
- 5393 Sawmill Rd Unit 22
- 5393 Sawmill Rd Unit 6