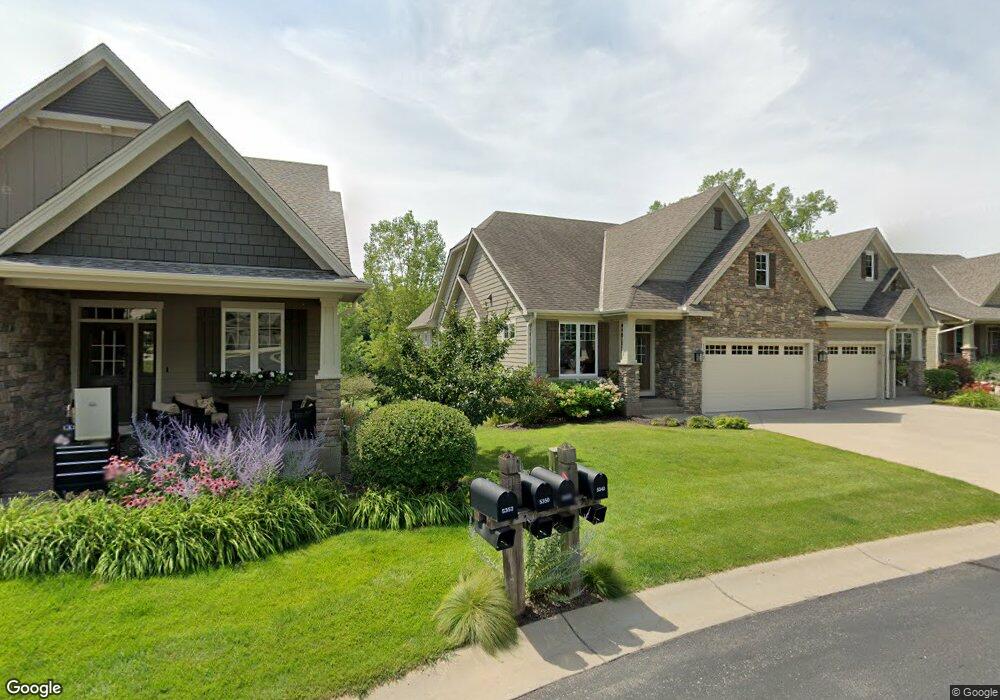
5352 Barrington Way Excelsior, MN 55331
Estimated Value: $844,612 - $888,000
3
Beds
3
Baths
3,310
Sq Ft
$263/Sq Ft
Est. Value
About This Home
This home is located at 5352 Barrington Way, Excelsior, MN 55331 and is currently estimated at $869,653, approximately $262 per square foot. 5352 Barrington Way is a home located in Hennepin County with nearby schools including Deephaven Elementary School, Minnetonka East Middle School, and Minnetonka Senior High School.
Ownership History
Date
Name
Owned For
Owner Type
Purchase Details
Closed on
Apr 30, 2021
Sold by
Liebsch Jerome B and Liebsch Ellen M
Bought by
Liebsch Jerome B and Bury Liebsch Ellen
Current Estimated Value
Home Financials for this Owner
Home Financials are based on the most recent Mortgage that was taken out on this home.
Original Mortgage
$357,000
Outstanding Balance
$323,531
Interest Rate
3.1%
Mortgage Type
New Conventional
Estimated Equity
$546,122
Purchase Details
Closed on
Jun 25, 2013
Sold by
Swanson Douglas Lynn and Mccauley Kathleen Mary
Bought by
Potter Mitchell C and Potter Elizabeth M
Home Financials for this Owner
Home Financials are based on the most recent Mortgage that was taken out on this home.
Original Mortgage
$416,000
Interest Rate
3.62%
Mortgage Type
New Conventional
Purchase Details
Closed on
Sep 11, 2006
Sold by
Capestone Builders Corp
Bought by
Holtmeier Kathleen
Create a Home Valuation Report for This Property
The Home Valuation Report is an in-depth analysis detailing your home's value as well as a comparison with similar homes in the area
Home Values in the Area
Average Home Value in this Area
Purchase History
| Date | Buyer | Sale Price | Title Company |
|---|---|---|---|
| Liebsch Jerome B | -- | None Available | |
| Potter Mitchell C | $504,705 | Multiple | |
| Holtmeier Kathleen | $617,500 | -- |
Source: Public Records
Mortgage History
| Date | Status | Borrower | Loan Amount |
|---|---|---|---|
| Open | Liebsch Jerome B | $357,000 | |
| Closed | Potter Mitchell C | $416,000 |
Source: Public Records
Tax History Compared to Growth
Tax History
| Year | Tax Paid | Tax Assessment Tax Assessment Total Assessment is a certain percentage of the fair market value that is determined by local assessors to be the total taxable value of land and additions on the property. | Land | Improvement |
|---|---|---|---|---|
| 2024 | $10,703 | $850,200 | $290,000 | $560,200 |
| 2023 | $9,890 | $823,900 | $271,300 | $552,600 |
| 2022 | $8,348 | $681,000 | $156,000 | $525,000 |
| 2021 | $9,263 | $631,000 | $200,000 | $431,000 |
| 2020 | $8,906 | $686,000 | $290,000 | $396,000 |
| 2019 | $8,592 | $635,000 | $250,000 | $385,000 |
| 2018 | $7,992 | $612,000 | $215,000 | $397,000 |
| 2017 | $8,000 | $569,000 | $195,000 | $374,000 |
| 2016 | $7,257 | $516,000 | $185,000 | $331,000 |
| 2015 | $7,009 | $500,000 | $135,000 | $365,000 |
| 2014 | -- | $464,000 | $150,000 | $314,000 |
Source: Public Records
Map
Nearby Homes
- 20472 Radisson Rd
- 20381 Excelsior Blvd
- 5470 Carrie Ln
- 5100 Greenwood Cir
- 19767 Waterford Ct
- 20060 Vine St
- 21735 Fairview St
- 859 Excelsior Blvd
- 20025 Manor Rd
- 4667 Bayswater Rd
- 4900 Meadville St
- 4940 Meadville St
- 6015 Ridge Rd
- 5080 Meadville St
- 19635 Hillside St
- 5150 Meadville St
- 6060 Ridge Rd
- 19700 Hillside St
- 12806 Woodhaven Place
- 12802 Woodhaven Place
- 5352 5352 Barrington Way
- 5350 Barrington Way
- 5350 5350 Barrington Way
- 5360 5360 Barrington Way
- 5360 5360 Barrington-Way-
- 5360 Barrington Way
- 5362 5362 Barrington Way
- 5362 5362 Barrington-Way-
- 5362 Barrington Way
- 5342 Barrington Way
- 5342 5342 Barrington Way
- 5340 Barrington Way
- 5370 5370 Barrington-Way-
- 5370 5370 Barrington Way
- 5370 Barrington Way
- 5345 5345 Barrington Way
- 5345 Barrington Way
- 5345 Barrington Way
- 5367 5367 Barrington Way
- 5367 Barrington Way