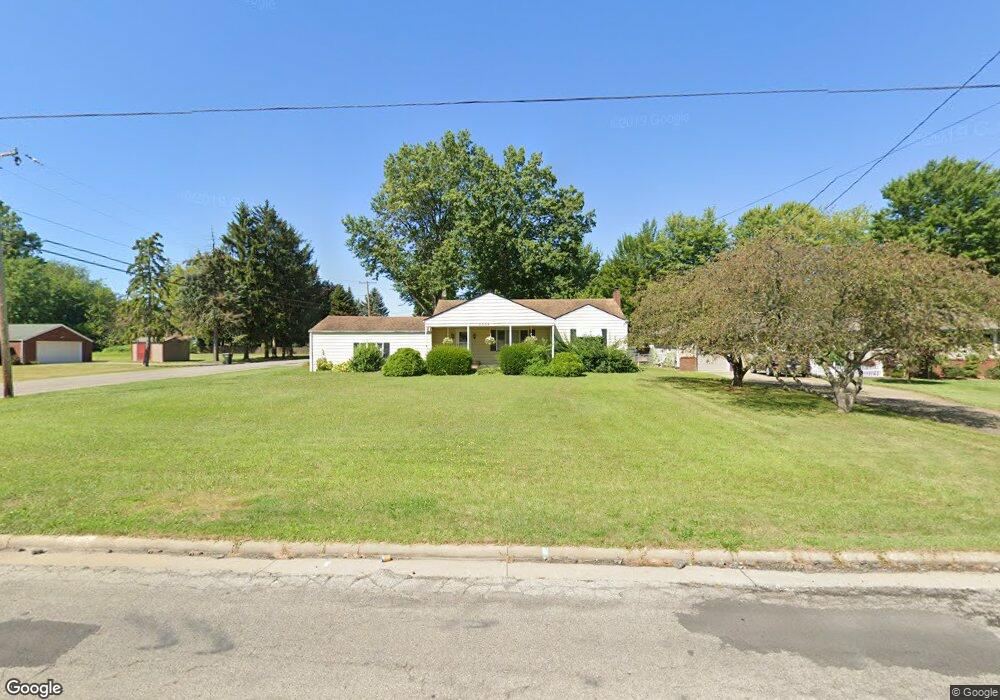
5352 Sheridan Rd Youngstown, OH 44514
Estimated Value: $152,627 - $162,000
3
Beds
1
Bath
1,124
Sq Ft
$140/Sq Ft
Est. Value
About This Home
This home is located at 5352 Sheridan Rd, Youngstown, OH 44514 and is currently estimated at $157,657, approximately $140 per square foot. 5352 Sheridan Rd is a home located in Mahoning County with nearby schools including Paul C. Bunn Elementary School, Clear Horizons Early College High School, and Chaney High School.
Ownership History
Date
Name
Owned For
Owner Type
Purchase Details
Closed on
Aug 8, 2005
Sold by
Ranno Donna M and Delost Donna M
Bought by
Burkhart Kathleen A
Current Estimated Value
Home Financials for this Owner
Home Financials are based on the most recent Mortgage that was taken out on this home.
Original Mortgage
$45,000
Outstanding Balance
$23,639
Interest Rate
5.66%
Mortgage Type
Fannie Mae Freddie Mac
Estimated Equity
$134,018
Purchase Details
Closed on
Sep 25, 1995
Sold by
Suchora Joseph L
Bought by
Delost Donna
Home Financials for this Owner
Home Financials are based on the most recent Mortgage that was taken out on this home.
Original Mortgage
$62,934
Interest Rate
7.78%
Mortgage Type
FHA
Purchase Details
Closed on
Sep 17, 1970
Bought by
Suchora Joseph L and M M
Create a Home Valuation Report for This Property
The Home Valuation Report is an in-depth analysis detailing your home's value as well as a comparison with similar homes in the area
Home Values in the Area
Average Home Value in this Area
Purchase History
| Date | Buyer | Sale Price | Title Company |
|---|---|---|---|
| Burkhart Kathleen A | $76,000 | -- | |
| Delost Donna | $63,000 | -- | |
| Suchora Joseph L | -- | -- |
Source: Public Records
Mortgage History
| Date | Status | Borrower | Loan Amount |
|---|---|---|---|
| Open | Burkhart Kathleen A | $45,000 | |
| Previous Owner | Delost Donna | $62,934 |
Source: Public Records
Tax History Compared to Growth
Tax History
| Year | Tax Paid | Tax Assessment Tax Assessment Total Assessment is a certain percentage of the fair market value that is determined by local assessors to be the total taxable value of land and additions on the property. | Land | Improvement |
|---|---|---|---|---|
| 2024 | $1,517 | $36,010 | $7,980 | $28,030 |
| 2023 | $1,542 | $36,010 | $7,980 | $28,030 |
| 2022 | $1,265 | $25,220 | $7,170 | $18,050 |
| 2021 | $1,265 | $25,220 | $7,170 | $18,050 |
| 2020 | $1,271 | $25,220 | $7,170 | $18,050 |
| 2019 | $1,203 | $21,740 | $6,180 | $15,560 |
| 2018 | $1,113 | $21,740 | $6,180 | $15,560 |
| 2017 | $1,077 | $21,740 | $6,180 | $15,560 |
| 2016 | $1,240 | $24,720 | $7,560 | $17,160 |
| 2015 | $1,218 | $24,720 | $7,560 | $17,160 |
| 2014 | $1,211 | $24,720 | $7,560 | $17,160 |
| 2013 | $1,197 | $24,720 | $7,560 | $17,160 |
Source: Public Records
Map
Nearby Homes
- 1919 Wingate Rd
- 0 Woodlawn Ave
- 0 Oles Ave
- 1841 Wingate Rd
- 1830 Halbert Dr
- 1828 Basil Ave
- 1933 Brandon Ave
- 1890 Mathews Rd
- 5710 Youngstown Poland Rd
- 1894 Lealand Ave
- 0 Lemoyne Ave
- 1720 Sequoya Dr
- 0 Mathews Rd Unit 5149232
- 0 Mathews Rd Unit 5143059
- 2089 Shetland Ln
- 1913 Country Club Ave
- 576 W Harvey St
- 2035 Woodward Ave
- 2128 Lyon Blvd
- 550 Brandon Ave
- 5342 Sheridan Rd
- 5410 Sheridan Rd
- 5334 Sheridan Rd
- 5355 Linger Place
- 5351 Linger Place
- 5416 Sheridan Rd
- 1895 Wingate Rd
- 5345 Linger Place
- 5328 Sheridan Rd
- 5341 Linger Place
- 5426 Sheridan Rd
- 1889 Wingate Rd
- 5320 Sheridan Rd
- 5337 Linger Place
- 1910 Wingate Rd
- 5345 Sheridan Rd
- 5502 Sheridan Rd
- 5337 Sheridan Rd
- 5354 Linger Place
- 5333 Linger Place