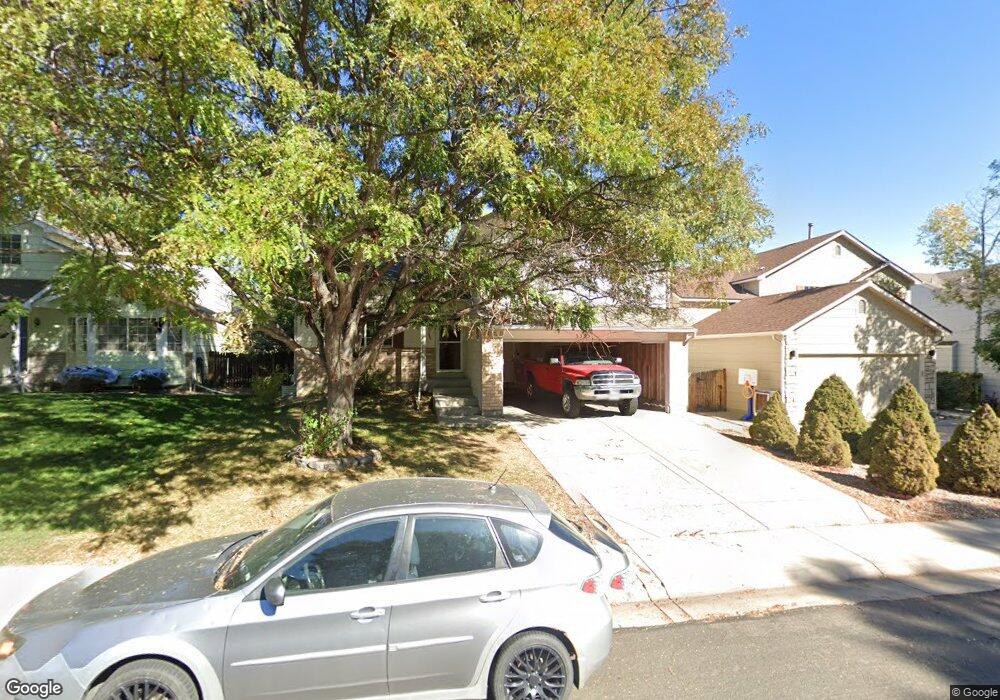
5353 E 128th Cir Thornton, CO 80241
Estimated Value: $472,947 - $508,000
3
Beds
2
Baths
1,493
Sq Ft
$331/Sq Ft
Est. Value
About This Home
This home is located at 5353 E 128th Cir, Thornton, CO 80241 and is currently estimated at $494,237, approximately $331 per square foot. 5353 E 128th Cir is a home located in Adams County with nearby schools including Eagleview Elementary School, Rocky Top Middle School, and Horizon High School.
Ownership History
Date
Name
Owned For
Owner Type
Purchase Details
Closed on
Aug 6, 2014
Sold by
Bendixen Derek J and Stohl Nancy Lee
Bought by
Vandervelde Mark
Current Estimated Value
Purchase Details
Closed on
Oct 20, 2006
Sold by
Leddy Matthew R and Leddy Lisa M
Bought by
Bendixen Derek J and Stohl Nancy Lee
Home Financials for this Owner
Home Financials are based on the most recent Mortgage that was taken out on this home.
Original Mortgage
$164,000
Interest Rate
6.28%
Mortgage Type
Unknown
Purchase Details
Closed on
Feb 7, 1997
Sold by
Melody Homes Inc
Bought by
Leddy Matthew R and Leddy Lisa M
Home Financials for this Owner
Home Financials are based on the most recent Mortgage that was taken out on this home.
Original Mortgage
$122,979
Interest Rate
7.68%
Mortgage Type
FHA
Create a Home Valuation Report for This Property
The Home Valuation Report is an in-depth analysis detailing your home's value as well as a comparison with similar homes in the area
Purchase History
| Date | Buyer | Sale Price | Title Company |
|---|---|---|---|
| Vandervelde Mark | $230,000 | Heritage Title | |
| Bendixen Derek J | $205,000 | Chicago Title Co | |
| Leddy Matthew R | $123,942 | Land Title |
Source: Public Records
Mortgage History
| Date | Status | Borrower | Loan Amount |
|---|---|---|---|
| Previous Owner | Bendixen Derek J | $164,000 | |
| Previous Owner | Leddy Matthew R | $122,979 |
Source: Public Records
Tax History
| Year | Tax Paid | Tax Assessment Tax Assessment Total Assessment is a certain percentage of the fair market value that is determined by local assessors to be the total taxable value of land and additions on the property. | Land | Improvement |
|---|---|---|---|---|
| 2025 | $3,180 | $32,570 | $6,800 | $25,770 |
| 2024 | $3,180 | $29,940 | $6,250 | $23,690 |
| 2023 | $3,147 | $34,440 | $6,160 | $28,280 |
| 2022 | $2,846 | $25,840 | $6,320 | $19,520 |
| 2021 | $2,942 | $25,840 | $6,320 | $19,520 |
| 2020 | $2,631 | $23,580 | $6,510 | $17,070 |
| 2019 | $2,636 | $23,580 | $6,510 | $17,070 |
| 2018 | $2,267 | $19,700 | $6,840 | $12,860 |
| 2017 | $2,061 | $19,700 | $6,840 | $12,860 |
| 2016 | $1,909 | $17,760 | $3,820 | $13,940 |
| 2015 | $1,906 | $17,760 | $3,820 | $13,940 |
| 2014 | $1,590 | $14,400 | $2,950 | $11,450 |
Source: Public Records
Map
Nearby Homes
- 5341 E 129th Way
- 5024 E 127th Way
- 5628 Hudson Cir
- 4756 E 129th Place
- 12698 Fairfax St
- 13271 Holly St Unit B
- 12767 Ivanhoe St
- 12770 Ivanhoe St
- 12768 Ivanhoe St
- 12792 Ivy St
- 5740 E 127th Place
- 12625 Fairfax St
- 12870 Jasmine St Unit A
- 12774 Jasmine Ct
- 12791 Clermont St
- 12562 Forest St
- 12884 Jasmine St Unit C
- 12993 Birch Dr
- 12856 Jasmine St Unit B
- 12506 Forest Dr
- 5363 E 128th Cir
- 5343 E 128th Cir
- 5348 E 129th Ave
- 5373 E 128th Cir
- 5333 E 128th Cir
- 5338 E 129th Ave
- 5358 E 129th Ave
- 5328 E 129th Ave
- 5368 E 129th Ave
- 5352 E 128th Cir
- 5383 E 128th Cir
- 5362 E 128th Cir
- 5332 E 128th Cir
- 5323 E 128th Cir
- 5318 E 129th Ave
- 5372 E 128th Cir
- 5378 E 129th Ave
- 5393 E 128th Cir
- 5313 E 128th Cir
- 5312 E 128th Cir
Your Personal Tour Guide
Ask me questions while you tour the home.