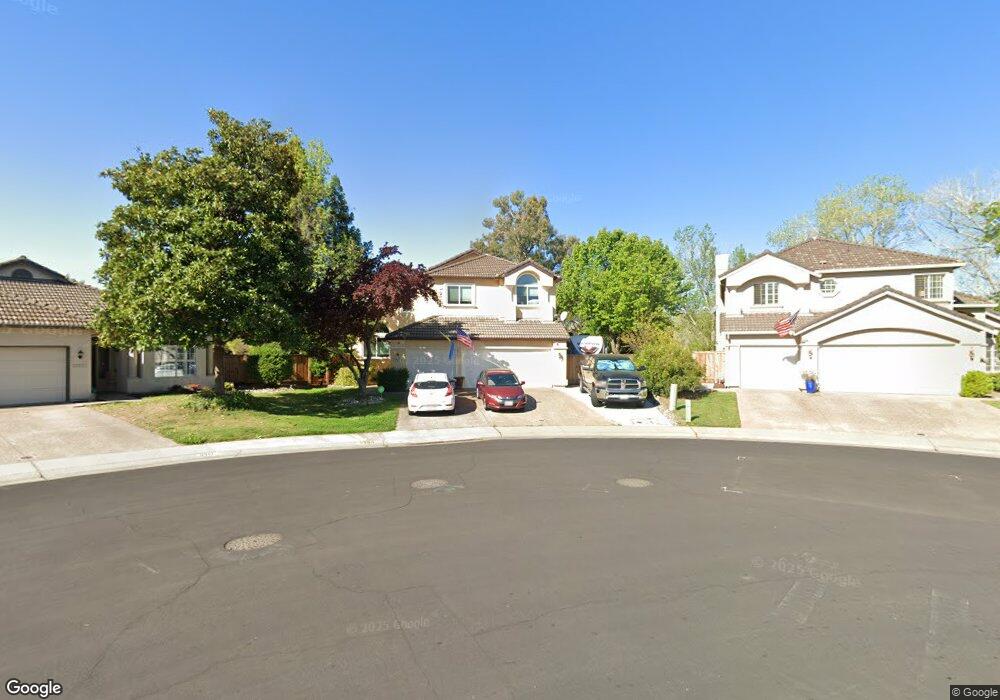
5353 Swindon Rd Rocklin, CA 95765
Stanford Ranch NeighborhoodEstimated Value: $630,000 - $844,898
5
Beds
3
Baths
2,437
Sq Ft
$310/Sq Ft
Est. Value
About This Home
This home is located at 5353 Swindon Rd, Rocklin, CA 95765 and is currently estimated at $756,475, approximately $310 per square foot. 5353 Swindon Rd is a home located in Placer County with nearby schools including Breen Elementary, Granite Oaks Middle, and Rocklin High.
Ownership History
Date
Name
Owned For
Owner Type
Purchase Details
Closed on
Feb 25, 2020
Sold by
Whitney William G and Whitney Melissa
Bought by
Whitney William Graham and Whitney Melissa Jill
Current Estimated Value
Purchase Details
Closed on
Jul 11, 2005
Sold by
Revocabl Campo Jeanette Arlene
Bought by
Whitney William G
Home Financials for this Owner
Home Financials are based on the most recent Mortgage that was taken out on this home.
Original Mortgage
$460,000
Outstanding Balance
$166,211
Interest Rate
1%
Mortgage Type
New Conventional
Estimated Equity
$590,264
Purchase Details
Closed on
Dec 8, 2003
Sold by
Campo Jeanette A
Bought by
Campo Jeanette Arlene
Purchase Details
Closed on
Oct 22, 2001
Sold by
Campo Perry
Bought by
Campo Jeanette A
Purchase Details
Closed on
Jul 17, 1998
Sold by
Campo and Jeanette
Bought by
Campo Perry
Home Financials for this Owner
Home Financials are based on the most recent Mortgage that was taken out on this home.
Original Mortgage
$182,250
Interest Rate
7.01%
Mortgage Type
Purchase Money Mortgage
Create a Home Valuation Report for This Property
The Home Valuation Report is an in-depth analysis detailing your home's value as well as a comparison with similar homes in the area
Home Values in the Area
Average Home Value in this Area
Purchase History
| Date | Buyer | Sale Price | Title Company |
|---|---|---|---|
| Whitney William Graham | -- | None Available | |
| Whitney William G | $575,000 | California Title Co Of Nc | |
| Campo Jeanette Arlene | -- | -- | |
| Campo Jeanette A | -- | -- | |
| Campo Perry | -- | Financial Title Company |
Source: Public Records
Mortgage History
| Date | Status | Borrower | Loan Amount |
|---|---|---|---|
| Open | Whitney William G | $460,000 | |
| Previous Owner | Campo Perry | $182,250 |
Source: Public Records
Tax History
| Year | Tax Paid | Tax Assessment Tax Assessment Total Assessment is a certain percentage of the fair market value that is determined by local assessors to be the total taxable value of land and additions on the property. | Land | Improvement |
|---|---|---|---|---|
| 2025 | $8,561 | $785,770 | $198,147 | $587,623 |
| 2023 | $8,561 | $755,258 | $190,453 | $564,805 |
| 2022 | $8,022 | $710,000 | $179,000 | $531,000 |
| 2021 | $6,583 | $574,000 | $144,700 | $429,300 |
| 2020 | $6,563 | $567,000 | $143,000 | $424,000 |
| 2019 | $6,543 | $562,000 | $141,700 | $420,300 |
| 2018 | $6,054 | $522,000 | $131,600 | $390,400 |
| 2017 | $5,596 | $471,000 | $118,800 | $352,200 |
| 2016 | $5,353 | $454,000 | $114,500 | $339,500 |
| 2015 | $5,196 | $439,000 | $110,700 | $328,300 |
| 2014 | $6,371 | $429,000 | $108,200 | $320,800 |
Source: Public Records
Map
Nearby Homes
- 5329 Wesley Rd
- 5309 Quane Ct
- 2211 Jason Ct
- 2024 Archer Cir
- 5116 Camden Rd
- 5112 Stratton Ct
- 1914 Harvest Ct
- 4714 Durham Ct
- 2712 Ashland Ct
- 3140 Golden Trail St
- 3146 Golden Trail St
- 4730 Stuart St
- 2518 Cowboy Ct
- 2408 Galloping Trail Ct
- 2904 Avon Rd
- 1707 Poppy Dr
- 1208 Reading Way Unit 80
- 3456 Hidden Ranch Loop
- 1701 Poppy Dr
- 5512 Butte View Ct
- 5351 Swindon Rd
- 5355 Swindon Rd
- 5349 Swindon Rd
- 5357 Swindon Rd
- 5569 Cabrillo Ct
- 5568 Cabrillo Ct
- 5359 Swindon Rd
- 5347 Swindon Rd
- 5348 Swindon Rd
- 5567 Cabrillo Ct
- 5566 Cabrillo Ct
- 5361 Swindon Rd
- 5565 Cabrillo Ct
- 5345 Swindon Rd
- 5346 Swindon Rd
- 5564 Cabrillo Ct
- 5413 Quane Rd
- 2723 San Miguel Ct
- 5363 Swindon Rd
- 5562 Cabrillo Ct
Your Personal Tour Guide
Ask me questions while you tour the home.