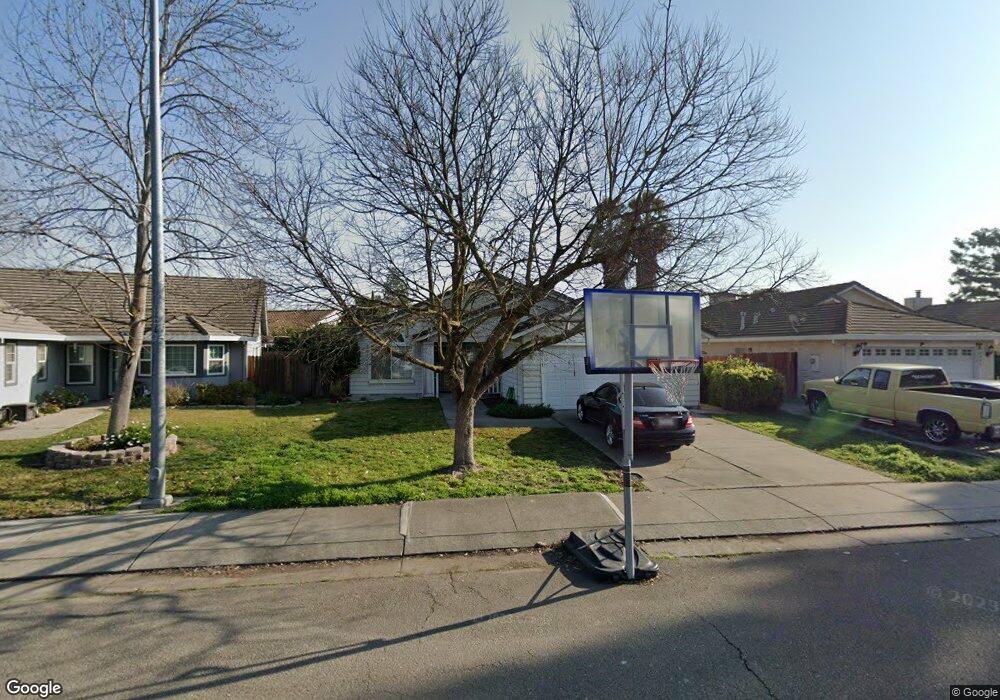
5355 Barbados Cir Stockton, CA 95210
Valley Oak NeighborhoodEstimated Value: $326,000 - $440,000
4
Beds
2
Baths
1,537
Sq Ft
$255/Sq Ft
Est. Value
About This Home
This home is located at 5355 Barbados Cir, Stockton, CA 95210 and is currently estimated at $391,594, approximately $254 per square foot. 5355 Barbados Cir is a home located in San Joaquin County with nearby schools including Rio Calaveras Elementary School, George W. Bush Elementary School, and Valentine Peyton Elementary School.
Ownership History
Date
Name
Owned For
Owner Type
Purchase Details
Closed on
Jul 20, 1998
Sold by
Va
Bought by
Huang Anguo and Huang Sandy
Current Estimated Value
Home Financials for this Owner
Home Financials are based on the most recent Mortgage that was taken out on this home.
Original Mortgage
$60,000
Outstanding Balance
$12,289
Interest Rate
7.01%
Estimated Equity
$379,305
Purchase Details
Closed on
Jun 18, 1997
Sold by
David Felton Roosevelt and David Carol J
Bought by
Ge Capital Mtg Services Inc
Purchase Details
Closed on
Jul 25, 1994
Sold by
Cos Pichon Inc
Bought by
Felton Roosevelt David and Felton Carol J
Home Financials for this Owner
Home Financials are based on the most recent Mortgage that was taken out on this home.
Original Mortgage
$133,550
Interest Rate
8.73%
Mortgage Type
Assumption
Create a Home Valuation Report for This Property
The Home Valuation Report is an in-depth analysis detailing your home's value as well as a comparison with similar homes in the area
Home Values in the Area
Average Home Value in this Area
Purchase History
| Date | Buyer | Sale Price | Title Company |
|---|---|---|---|
| Huang Anguo | $100,500 | -- | |
| Ge Capital Mtg Services Inc | $90,783 | Fidelity National Title Co | |
| Felton Roosevelt David | $131,000 | San Joaquin Title Co |
Source: Public Records
Mortgage History
| Date | Status | Borrower | Loan Amount |
|---|---|---|---|
| Open | Huang Anguo | $60,000 | |
| Previous Owner | Felton Roosevelt David | $133,550 |
Source: Public Records
Tax History Compared to Growth
Tax History
| Year | Tax Paid | Tax Assessment Tax Assessment Total Assessment is a certain percentage of the fair market value that is determined by local assessors to be the total taxable value of land and additions on the property. | Land | Improvement |
|---|---|---|---|---|
| 2025 | $2,210 | $172,746 | $47,026 | $125,720 |
| 2024 | $2,175 | $169,359 | $46,104 | $123,255 |
| 2023 | $2,128 | $166,039 | $45,200 | $120,839 |
| 2022 | $2,085 | $162,784 | $44,314 | $118,470 |
| 2021 | $2,006 | $159,594 | $43,446 | $116,148 |
| 2020 | $2,044 | $157,959 | $43,001 | $114,958 |
| 2019 | $2,036 | $154,862 | $42,158 | $112,704 |
| 2018 | $1,999 | $151,827 | $41,332 | $110,495 |
| 2017 | $1,896 | $148,851 | $40,522 | $108,329 |
| 2016 | $1,931 | $145,934 | $39,728 | $106,206 |
| 2014 | $1,839 | $140,926 | $38,365 | $102,561 |
Source: Public Records
Map
Nearby Homes
- 5271 Barbados Cir
- 5816 Caribbean Cir
- 5831 Caribbean Cir
- 2442 Brandywine Ct
- 5431 Strawberry Way
- 1122 Morning Dew Place
- 5622 Jeffrey Ct
- 5813 Fred Russo Dr
- 806 E Longview Ave
- 1608 Bonaire Cir
- 6706 Tam o Shanter Dr Unit 34
- 6706 Tam o Shanter Dr Unit 45
- 6706 Tam O'Shanter Dr Unit 112
- 6706 Tam o Shanter Dr Unit 61
- 6706 Tam O'Shanter Dr Unit 72
- 6706 Tam o Shanter Dr Unit 126
- 6706 Tam O'Shanter Dr Unit 58
- 6706 Tam o Shanter Dr Unit 66
- 813 Cave Ln
- 5718 Krissi Ct
- 5357 Barbados Cir
- 5353 Barbados Cir
- 1963 Korbel Ct
- 1949 Korbel Ct
- 5359 Barbados Cir
- 1977 Korbel Ct
- 5351 Barbados Cir
- 1935 Korbel Ct
- 5342 Barbados Cir
- 5356 Barbados Cir
- 5361 Barbados Cir
- 1991 Korbel Ct
- 1921 Korbel Ct
- 5358 Barbados Cir
- 5349 Barbados Cir
- 5360 Barbados Cir
- 5340 Barbados Cir
- 5363 Barbados Cir
- 1907 Korbel Ct
- 5362 Barbados Cir