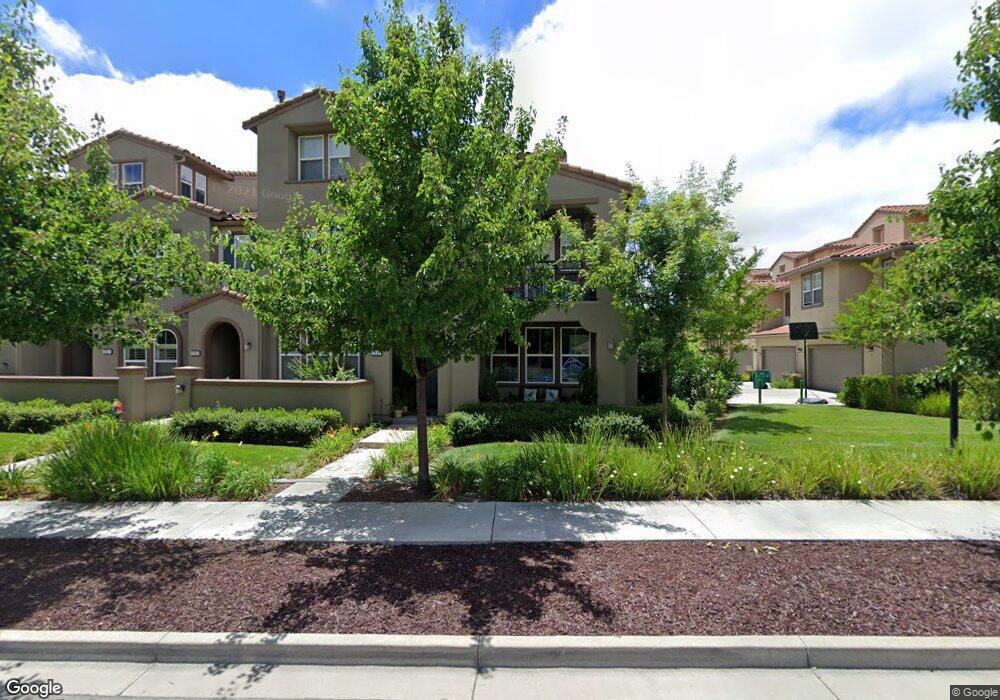
5356 Fioli Loop San Ramon, CA 94582
Gale Ranch-Windemere NeighborhoodEstimated Value: $1,011,000 - $1,174,000
3
Beds
3
Baths
2,050
Sq Ft
$528/Sq Ft
Est. Value
About This Home
This home is located at 5356 Fioli Loop, San Ramon, CA 94582 and is currently estimated at $1,083,121, approximately $528 per square foot. 5356 Fioli Loop is a home located in Contra Costa County with nearby schools including Hidden Hills Elementary School, Windemere Ranch Middle School, and Dougherty Valley High School.
Ownership History
Date
Name
Owned For
Owner Type
Purchase Details
Closed on
Jun 16, 2015
Sold by
Muniff Saad K and Munif Nadia M
Bought by
Mutchukota Thirumala Reddy and Mutchukota Shireesha
Current Estimated Value
Home Financials for this Owner
Home Financials are based on the most recent Mortgage that was taken out on this home.
Original Mortgage
$625,500
Outstanding Balance
$484,812
Interest Rate
3.77%
Mortgage Type
New Conventional
Estimated Equity
$598,309
Purchase Details
Closed on
Jun 25, 2010
Sold by
Centex Homes
Bought by
Munif Saad K and Munif Nadia M
Home Financials for this Owner
Home Financials are based on the most recent Mortgage that was taken out on this home.
Original Mortgage
$458,150
Interest Rate
4.82%
Mortgage Type
FHA
Create a Home Valuation Report for This Property
The Home Valuation Report is an in-depth analysis detailing your home's value as well as a comparison with similar homes in the area
Home Values in the Area
Average Home Value in this Area
Purchase History
| Date | Buyer | Sale Price | Title Company |
|---|---|---|---|
| Mutchukota Thirumala Reddy | $710,500 | Fidelity National Title Co | |
| Munif Saad K | $498,000 | First American Title Company |
Source: Public Records
Mortgage History
| Date | Status | Borrower | Loan Amount |
|---|---|---|---|
| Open | Mutchukota Thirumala Reddy | $625,500 | |
| Previous Owner | Munif Saad K | $458,150 |
Source: Public Records
Tax History
| Year | Tax Paid | Tax Assessment Tax Assessment Total Assessment is a certain percentage of the fair market value that is determined by local assessors to be the total taxable value of land and additions on the property. | Land | Improvement |
|---|---|---|---|---|
| 2025 | $13,183 | $853,303 | $510,781 | $342,522 |
| 2024 | $13,036 | $836,572 | $500,766 | $335,806 |
| 2023 | $13,036 | $820,170 | $490,948 | $329,222 |
| 2022 | $12,833 | $804,089 | $481,322 | $322,767 |
| 2021 | $12,535 | $788,324 | $471,885 | $316,439 |
| 2019 | $12,239 | $764,944 | $457,890 | $307,054 |
| 2018 | $11,860 | $749,946 | $448,912 | $301,034 |
| 2017 | $11,682 | $735,242 | $440,110 | $295,132 |
| 2016 | $11,583 | $720,827 | $431,481 | $289,346 |
| 2015 | $9,505 | $534,648 | $204,064 | $330,584 |
| 2014 | $9,415 | $524,176 | $200,067 | $324,109 |
Source: Public Records
Map
Nearby Homes
- 5216 Fioli Loop Unit 76
- 5300 Fioli Loop
- 257 Wimbledon Ct
- 217 Wimbledon Ct
- 2650 Casella Way
- 2464 Millstream Ln Unit 146
- 116 Macedon Ct
- 2359 Magnolia Bridge Dr
- 3252 Carpenter Way
- 6260 Main Branch Rd
- 2352 Millstream Ln
- 626 Karina Ct
- 1615 Lawrence Rd
- 3138 Ashbrook Ln
- 112 Begonia Ct
- 3132 Ashbrook Ln
- 6132 Alpine Blue Dr
- 5162 Rowan Dr
- 1610 Lawrence Rd
- 4976 Ivyleaf Springs Rd
- 5352 Fioli Loop
- 5358 Fioli Loop
- 5350 Fioli Loop Unit 115
- 2331 Ivy Hill Way
- 3127 Fioli Way Unit 127
- 5360 Fioli Loop Unit 128
- 2335 Ivy Hill Way
- 2333 Ivy Hill Way Unit 120
- 3119 Fioli Way Unit 126
- 5330 Fioli Loop Unit 122
- 3113 Fioli Way
- 5351 Fioli Loop Unit 89
- 3107 Fioli Way Unit 124
- 3101 Fioli Way
- 5302 Fioli Loop
- 5273 Fioli Loop Unit 90
- 5276 Fioli Loop
- 5361 Fioli Loop Unit 96
- 5316 Fioli Loop Unit 114
- 5267 Fioli Loop Unit 91
Your Personal Tour Guide
Ask me questions while you tour the home.