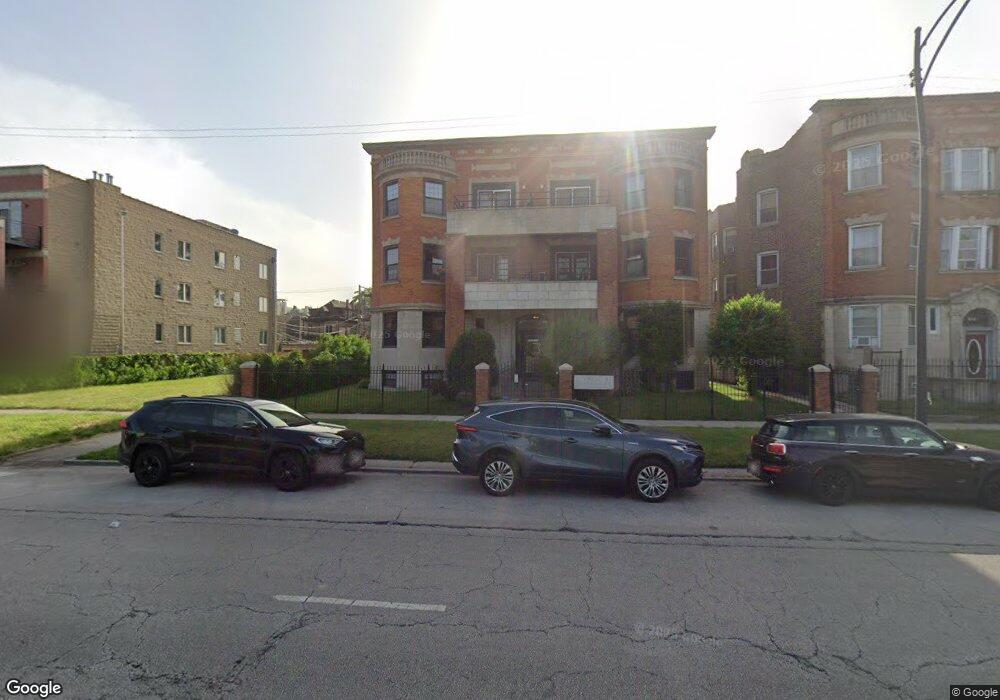
5356 S Indiana Ave Unit 2N Chicago, IL 60615
Washington Park NeighborhoodEstimated Value: $218,000 - $309,000
3
Beds
2
Baths
17,792
Sq Ft
$15/Sq Ft
Est. Value
About This Home
This home is located at 5356 S Indiana Ave Unit 2N, Chicago, IL 60615 and is currently estimated at $260,860, approximately $14 per square foot. 5356 S Indiana Ave Unit 2N is a home located in Cook County with nearby schools including Burke Elementary School, Wendell Phillips Academy High School, and CICS Washington Park.
Ownership History
Date
Name
Owned For
Owner Type
Purchase Details
Closed on
Nov 6, 2003
Sold by
Sokolowski Marek
Bought by
Easley Deborah
Current Estimated Value
Home Financials for this Owner
Home Financials are based on the most recent Mortgage that was taken out on this home.
Original Mortgage
$199,405
Outstanding Balance
$88,381
Interest Rate
5.37%
Mortgage Type
Negative Amortization
Estimated Equity
$172,479
Create a Home Valuation Report for This Property
The Home Valuation Report is an in-depth analysis detailing your home's value as well as a comparison with similar homes in the area
Home Values in the Area
Average Home Value in this Area
Purchase History
| Date | Buyer | Sale Price | Title Company |
|---|---|---|---|
| Easley Deborah | $210,000 | Pntn |
Source: Public Records
Mortgage History
| Date | Status | Borrower | Loan Amount |
|---|---|---|---|
| Open | Easley Deborah | $199,405 |
Source: Public Records
Tax History Compared to Growth
Tax History
| Year | Tax Paid | Tax Assessment Tax Assessment Total Assessment is a certain percentage of the fair market value that is determined by local assessors to be the total taxable value of land and additions on the property. | Land | Improvement |
|---|---|---|---|---|
| 2024 | $3,498 | $23,870 | $5,581 | $18,289 |
| 2023 | $3,687 | $22,490 | $5,581 | $16,909 |
| 2022 | $3,687 | $24,028 | $5,581 | $18,447 |
| 2021 | $3,637 | $24,027 | $5,581 | $18,446 |
| 2020 | $1,014 | $10,136 | $2,710 | $7,426 |
| 2019 | $1,005 | $11,176 | $2,710 | $8,466 |
| 2018 | $1,537 | $13,964 | $2,710 | $11,254 |
| 2017 | $422 | $8,038 | $2,232 | $5,806 |
| 2016 | $753 | $8,038 | $2,232 | $5,806 |
| 2015 | $649 | $8,038 | $2,232 | $5,806 |
| 2014 | $1,414 | $12,026 | $1,913 | $10,113 |
| 2013 | $1,709 | $12,026 | $1,913 | $10,113 |
Source: Public Records
Map
Nearby Homes
- 5410 S Indiana Ave
- 5408 S Michigan Ave Unit 1S
- 209 E 53rd St
- 5341 S Wabash Ave Unit 5347
- 5317 S Prairie Ave
- 5330 S Wabash Ave
- 5237 S Michigan Ave Unit 1N
- 5225 S Indiana Ave
- 5333 S Calumet Ave
- 5331 S Calumet Ave
- 5341 S Calumet Ave
- 5530 S Michigan Ave
- 5169 S Michigan Ave
- 5201 S Wabash Ave
- 5127 S Indiana Ave
- 5536 S State St
- 5150 S King Dr Unit 2A
- 5615 S Calumet Ave Unit 2N
- 5619 S Calumet Ave Unit 2
- 5148 S King Dr Unit B3
- 5356 S Indiana Ave Unit 3N
- 5356 S Indiana Ave Unit 1N
- 5356 S Indiana Ave Unit GN
- 5356 S Indiana Ave Unit 1S
- 5356 S Indiana Ave Unit 3S
- 5356 S Indiana Ave Unit 2S
- 5356 S Indiana Ave Unit GS
- 5356 S Indiana Ave
- 5356 S Indiana Ave Unit 1
- 5358 S Indiana Ave Unit 1S
- 5350 S Indiana Ave
- 5346 S Indiana Ave
- 5342 S Indiana Ave
- 5342 S Indiana Ave
- 5406 S Indiana Ave Unit 1N
- 5406 S Indiana Ave Unit 4N
- 5406 S Indiana Ave Unit 3S
- 5406 S Indiana Ave
- 5406 S Indiana Ave Unit LS
- 5406 S Indiana Ave Unit LN