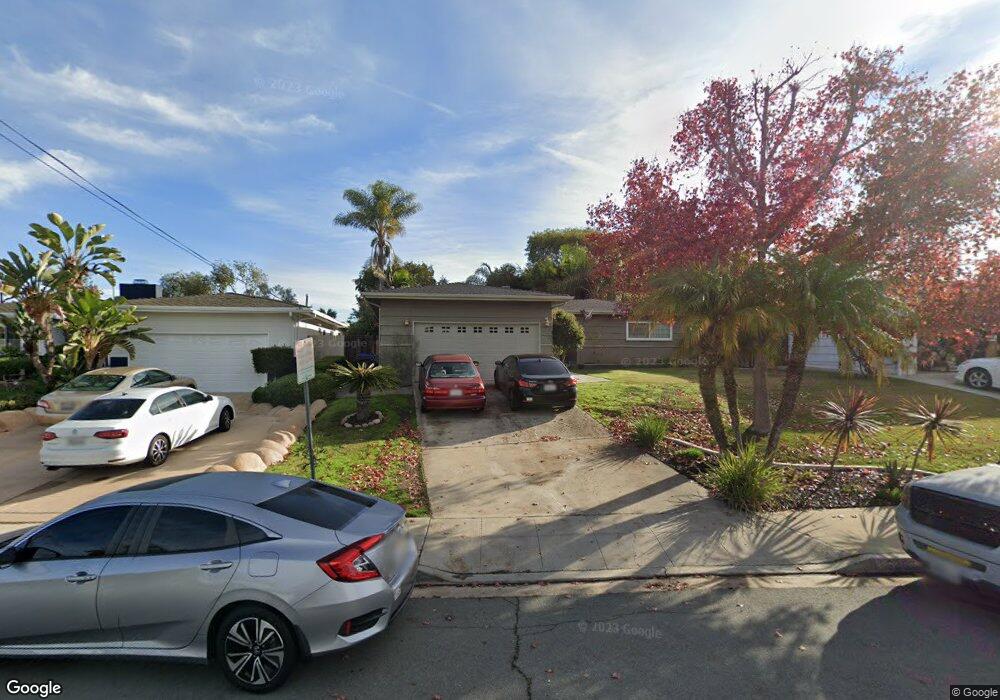
5357 W Falls View Dr San Diego, CA 92115
College East NeighborhoodEstimated Value: $977,000 - $1,181,000
3
Beds
2
Baths
1,328
Sq Ft
$790/Sq Ft
Est. Value
About This Home
This home is located at 5357 W Falls View Dr, San Diego, CA 92115 and is currently estimated at $1,048,845, approximately $789 per square foot. 5357 W Falls View Dr is a home located in San Diego County with nearby schools including Hardy Elementary School, Clay Elementary School, and Lewis Middle School.
Ownership History
Date
Name
Owned For
Owner Type
Purchase Details
Closed on
Mar 11, 2011
Sold by
Rapp Ashley J
Bought by
Hemmens Jason W and Hemmens Jennifer L
Current Estimated Value
Home Financials for this Owner
Home Financials are based on the most recent Mortgage that was taken out on this home.
Original Mortgage
$389,860
Outstanding Balance
$267,367
Interest Rate
4.75%
Mortgage Type
FHA
Estimated Equity
$781,478
Purchase Details
Closed on
Oct 23, 2002
Sold by
Rapp Sean
Bought by
Rapp Ashley J
Purchase Details
Closed on
Oct 14, 1998
Sold by
Seelert Nanci S Aka Easland Nanci S
Bought by
Rapp Sean and Rapp Ashley J
Home Financials for this Owner
Home Financials are based on the most recent Mortgage that was taken out on this home.
Original Mortgage
$108,000
Interest Rate
6.5%
Create a Home Valuation Report for This Property
The Home Valuation Report is an in-depth analysis detailing your home's value as well as a comparison with similar homes in the area
Home Values in the Area
Average Home Value in this Area
Purchase History
| Date | Buyer | Sale Price | Title Company |
|---|---|---|---|
| Hemmens Jason W | $400,000 | California Title Company | |
| Rapp Ashley J | -- | -- | |
| Rapp Sean | $185,500 | Chicago Title Co |
Source: Public Records
Mortgage History
| Date | Status | Borrower | Loan Amount |
|---|---|---|---|
| Open | Hemmens Jason W | $389,860 | |
| Previous Owner | Rapp Sean | $108,000 |
Source: Public Records
Tax History
| Year | Tax Paid | Tax Assessment Tax Assessment Total Assessment is a certain percentage of the fair market value that is determined by local assessors to be the total taxable value of land and additions on the property. | Land | Improvement |
|---|---|---|---|---|
| 2025 | $6,119 | $512,454 | $276,258 | $236,196 |
| 2024 | $6,119 | $502,407 | $270,842 | $231,565 |
| 2023 | $5,982 | $492,557 | $265,532 | $227,025 |
| 2022 | $5,822 | $482,900 | $260,326 | $222,574 |
| 2021 | $5,780 | $473,432 | $255,222 | $218,210 |
| 2020 | $5,709 | $468,579 | $252,606 | $215,973 |
| 2019 | $5,606 | $459,392 | $247,653 | $211,739 |
| 2018 | $5,240 | $450,386 | $242,798 | $207,588 |
| 2017 | $80 | $441,556 | $238,038 | $203,518 |
| 2016 | $5,031 | $432,899 | $233,371 | $199,528 |
| 2015 | $4,956 | $426,397 | $229,866 | $196,531 |
| 2014 | -- | $418,046 | $225,364 | $192,682 |
Source: Public Records
Map
Nearby Homes
- 6303 Cleo St
- 6335 Cleo St
- 5230 Rincon St
- 6443 Cleo St
- 6407 Richard St
- 6181 Montezuma Rd
- 6459 Richard St
- 6206 Pontiac St
- 5191 Alumni Place
- 4941 Gary St
- 6497 Montezuma Rd
- 5245 Reservoir Dr
- 5067 Alumni Place
- 6266 Stewart St
- 5861 College Ave
- 6765 Alvarado Rd Unit 10
- 6775 Alvarado Rd Unit 7
- 4860 Rolando Ct Unit 52
- 4860 Rolando Ct Unit 81
- 4860 Rolando Ct Unit 75
- 5353 W Falls View Dr
- 5363 W Falls View Dr
- 5349 W Falls View Dr
- 5373 W Falls View Dr
- 5354 E Falls View Dr
- 5358 E Falls View Dr
- 5350 E Falls View Dr
- 5370 E Falls View Dr
- 5343 W Falls View Dr
- 5346 E Falls View Dr
- 5356 W Falls View Dr
- 5360 W Falls View Dr
- 5342 E Falls View Dr
- 5352 W Falls View Dr
- 5339 W Falls View Dr
- 5376 E Falls View Dr
- 5368 W Falls View Dr
- 5364 W Falls View Dr
- 5348 W Falls View Dr
- 5338 E Falls View Dr
Your Personal Tour Guide
Ask me questions while you tour the home.