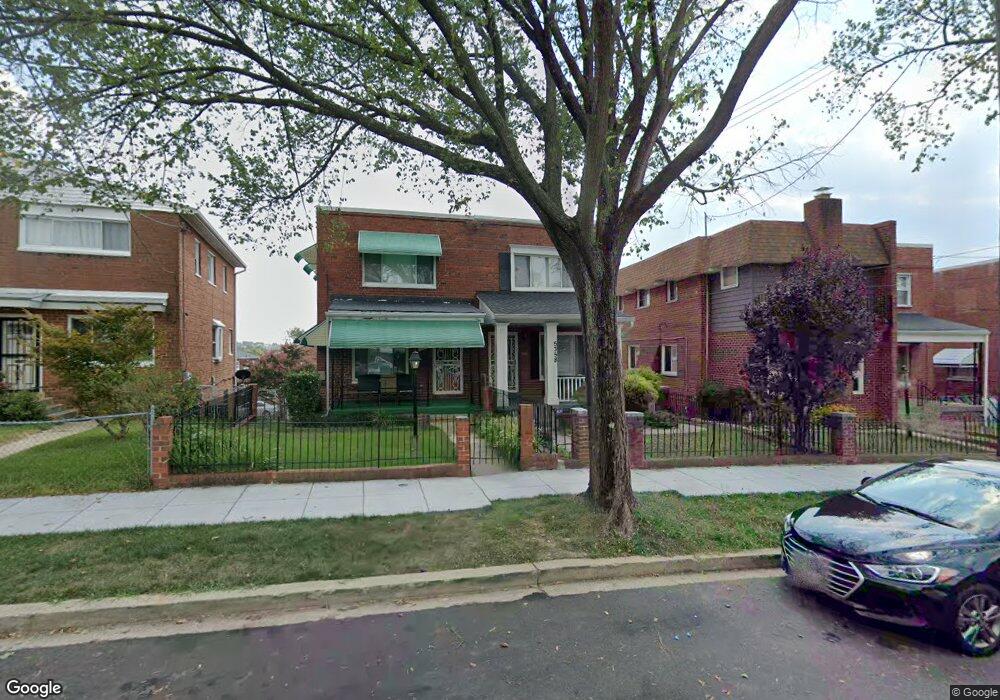
5358 Chillum Place NE Washington, DC 20011
Lamond Riggs NeighborhoodEstimated Value: $537,000 - $696,000
4
Beds
4
Baths
1,448
Sq Ft
$415/Sq Ft
Est. Value
About This Home
This home is located at 5358 Chillum Place NE, Washington, DC 20011 and is currently estimated at $601,536, approximately $415 per square foot. 5358 Chillum Place NE is a home located in District of Columbia with nearby schools including LaSalle-Backus Elementary School, Ida B. Wells Middle School, and Coolidge High School.
Ownership History
Date
Name
Owned For
Owner Type
Purchase Details
Closed on
Aug 16, 2010
Sold by
Moraes Anazimandro D
Bought by
Fairclough Jacqueline and Davidson Kerrian
Current Estimated Value
Home Financials for this Owner
Home Financials are based on the most recent Mortgage that was taken out on this home.
Original Mortgage
$296,525
Outstanding Balance
$198,517
Interest Rate
4.87%
Mortgage Type
FHA
Estimated Equity
$403,019
Purchase Details
Closed on
Apr 29, 2010
Sold by
Wells Fargo Bank Na Trustee
Bought by
Moraes Anazimandro D
Purchase Details
Closed on
Nov 25, 2009
Sold by
Cohn Sub Tr Edward S and Goldberg Sub Tr Stephen N
Bought by
Wells Fargo Bank Na Trustee
Purchase Details
Closed on
Aug 11, 2006
Sold by
Kirkland Gustas J
Bought by
Bonilla Jorge A and Rios Juan
Home Financials for this Owner
Home Financials are based on the most recent Mortgage that was taken out on this home.
Original Mortgage
$292,000
Interest Rate
6.88%
Mortgage Type
New Conventional
Create a Home Valuation Report for This Property
The Home Valuation Report is an in-depth analysis detailing your home's value as well as a comparison with similar homes in the area
Home Values in the Area
Average Home Value in this Area
Purchase History
| Date | Buyer | Sale Price | Title Company |
|---|---|---|---|
| Fairclough Jacqueline | $315,000 | -- | |
| Moraes Anazimandro D | $181,000 | -- | |
| Wells Fargo Bank Na Trustee | $331,699 | -- | |
| Bonilla Jorge A | $365,000 | -- |
Source: Public Records
Mortgage History
| Date | Status | Borrower | Loan Amount |
|---|---|---|---|
| Open | Fairclough Jacqueline | $296,525 | |
| Previous Owner | Bonilla Jorge A | $292,000 |
Source: Public Records
Tax History Compared to Growth
Tax History
| Year | Tax Paid | Tax Assessment Tax Assessment Total Assessment is a certain percentage of the fair market value that is determined by local assessors to be the total taxable value of land and additions on the property. | Land | Improvement |
|---|---|---|---|---|
| 2025 | $4,823 | $567,450 | $312,800 | $254,650 |
| 2024 | $4,728 | $556,260 | $311,240 | $245,020 |
| 2023 | $4,658 | $547,960 | $303,930 | $244,030 |
| 2022 | $4,423 | $520,400 | $287,070 | $233,330 |
| 2021 | $4,249 | $499,840 | $282,830 | $217,010 |
| 2020 | $4,195 | $493,520 | $276,560 | $216,960 |
| 2019 | $4,061 | $477,780 | $254,590 | $223,190 |
| 2018 | $3,877 | $456,140 | $0 | $0 |
| 2017 | $3,526 | $414,810 | $0 | $0 |
| 2016 | $3,096 | $364,290 | $0 | $0 |
| 2015 | $2,685 | $315,840 | $0 | $0 |
| 2014 | $2,502 | $294,380 | $0 | $0 |
Source: Public Records
Map
Nearby Homes
- 5320 Chillum Place NE
- 500 Hamilton St NE
- 5309 Chillum Place NE
- 813 Jefferson St NE
- 829 Oglethorpe St NE
- 821 Oglethorpe St NE
- 5541 S Dakota Ave NE
- 5908 8th St NE
- 719 Farragut Place NE
- 748 Oglethorpe St NE
- 642 Faraday Place NE
- 5916 8th St NE
- 5051 8th St NE
- 5031 S Dakota Ave NE
- 314 Farragut St NW
- 5008 10th St NE
- 723 Emerson St NE
- 735 Emerson St NE
- 5008 11th St NE
- 832 Delafield St NE
- 5356 Chillum Place NE
- 5360 Chillum Place NE
- 5362 Chillum Place NE
- 5354 Chillum Place NE
- 5364 Chillum Place NE
- 5352 Chillum Place NE Unit Bsmt
- 5352 Chillum Place NE
- 5350 Chillum Place NE
- 5366 Chillum Place NE
- 5348 Chillum Place NE
- 558 Ingraham St NE
- 560 Ingraham St NE
- 5368 Chillum Place NE
- 556 Ingraham St NE
- 600 Ingraham St NE
- 554 Ingraham St NE
- 602 Ingraham St NE
- 552 Ingraham St NE
- 5346 Chillum Place NE
- 5370 Chillum Place NE