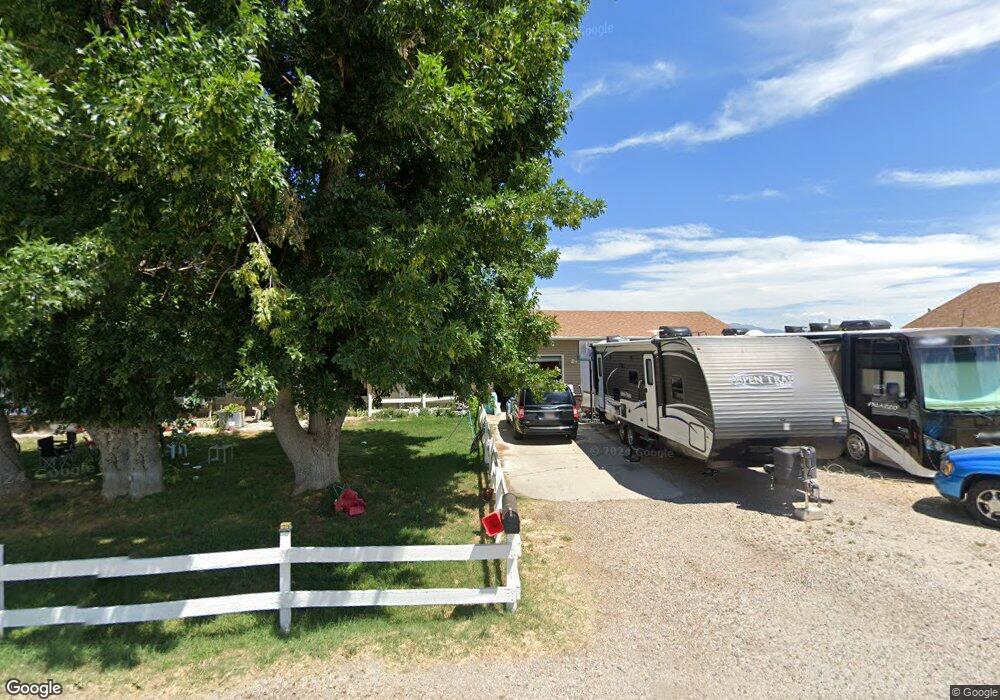
5358 S 7500 W Hooper, UT 84315
Estimated Value: $560,000 - $677,635
5
Beds
3
Baths
2,386
Sq Ft
$256/Sq Ft
Est. Value
About This Home
This home is located at 5358 S 7500 W, Hooper, UT 84315 and is currently estimated at $611,659, approximately $256 per square foot. 5358 S 7500 W is a home located in Weber County with nearby schools including Hooper Elementary School, Rocky Mountain Junior High School, and Fremont High School.
Ownership History
Date
Name
Owned For
Owner Type
Purchase Details
Closed on
Nov 26, 2024
Sold by
Jones Kevin R and Jones Shelly O
Bought by
Carreno Jose Rosario and Rodriguez Maria Elena
Current Estimated Value
Home Financials for this Owner
Home Financials are based on the most recent Mortgage that was taken out on this home.
Original Mortgage
$517,500
Outstanding Balance
$513,148
Interest Rate
6.44%
Mortgage Type
New Conventional
Estimated Equity
$98,511
Purchase Details
Closed on
Sep 1, 1998
Sold by
White Ayla Dianne
Bought by
Jones Kevin R and Jones Shelly O
Home Financials for this Owner
Home Financials are based on the most recent Mortgage that was taken out on this home.
Original Mortgage
$160,550
Interest Rate
6.93%
Purchase Details
Closed on
Jul 3, 1997
Sold by
White Gary M
Bought by
White Ayla Dianne
Create a Home Valuation Report for This Property
The Home Valuation Report is an in-depth analysis detailing your home's value as well as a comparison with similar homes in the area
Home Values in the Area
Average Home Value in this Area
Purchase History
| Date | Buyer | Sale Price | Title Company |
|---|---|---|---|
| Carreno Jose Rosario | -- | Us Title Insurance Agency | |
| Jones Kevin R | -- | -- | |
| White Ayla Dianne | -- | Mountain View Title |
Source: Public Records
Mortgage History
| Date | Status | Borrower | Loan Amount |
|---|---|---|---|
| Open | Carreno Jose Rosario | $517,500 | |
| Previous Owner | Jones Kevin R | $160,550 |
Source: Public Records
Tax History Compared to Growth
Tax History
| Year | Tax Paid | Tax Assessment Tax Assessment Total Assessment is a certain percentage of the fair market value that is determined by local assessors to be the total taxable value of land and additions on the property. | Land | Improvement |
|---|---|---|---|---|
| 2025 | $2,885 | $528,102 | $181,165 | $346,937 |
| 2024 | $2,771 | $285,993 | $100,180 | $185,813 |
| 2023 | $2,820 | $287,449 | $99,752 | $187,697 |
| 2022 | $2,930 | $303,600 | $77,411 | $226,189 |
| 2021 | $2,525 | $440,000 | $100,600 | $339,400 |
| 2020 | $2,333 | $373,000 | $90,608 | $282,392 |
| 2019 | $2,392 | $362,001 | $70,600 | $291,401 |
| 2018 | $2,270 | $329,001 | $70,600 | $258,401 |
| 2017 | $1,926 | $271,000 | $53,450 | $217,550 |
| 2016 | $1,851 | $141,534 | $27,957 | $113,577 |
| 2015 | $1,838 | $138,869 | $30,700 | $108,169 |
| 2014 | $1,707 | $125,585 | $30,700 | $94,885 |
Source: Public Records
Map
Nearby Homes
- 5319 S 7100 W
- 5801 S 7100 W
- 4100 S 5900 W
- 5752 W 2425 N
- 6014 W 5300 S
- 6036 W 4700 S
- 0 W 5500 S
- 3729 S 5600 W Unit 6
- 3720 S 5600 W Unit 2
- 3719 S 5600 W Unit 7
- 4146 S 5800 W Unit 5
- 4163 S 5800 W Unit 2
- 5335 W 5500 S
- 3632 S 5400 W
- 2084 N 4500 W
- 3706 S 5650 W Unit 9
- 4111 S 5350 W
- 3691 S 5600 W Unit 20
- 4879 S 5050 W
- 5478 W 3750 S