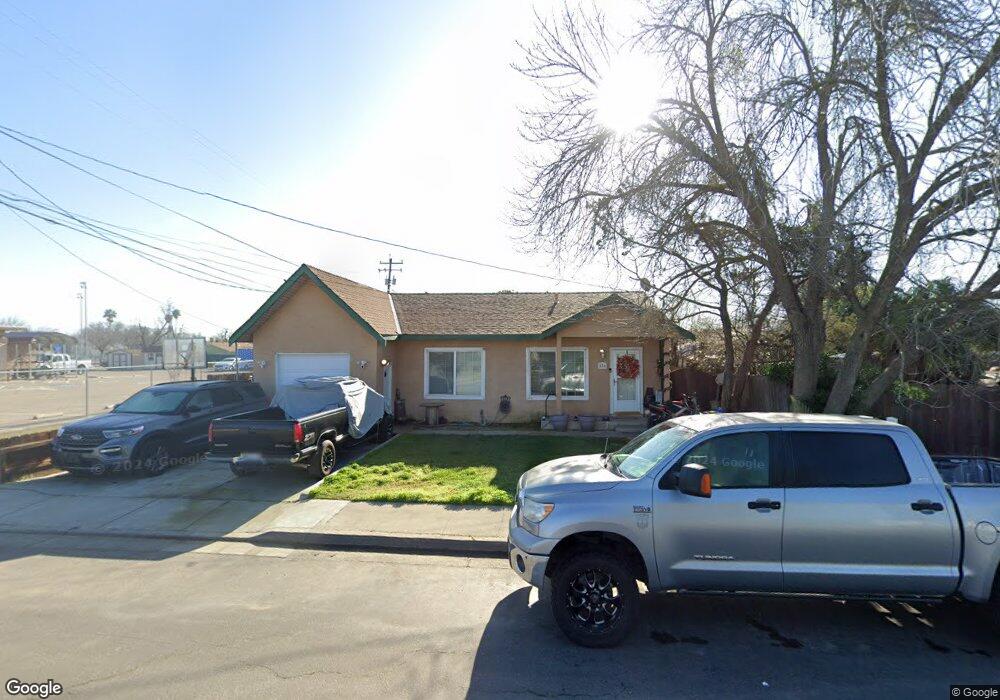
536 6th St Los Banos, CA 93635
Estimated Value: $221,110 - $266,000
2
Beds
1
Bath
672
Sq Ft
$376/Sq Ft
Est. Value
About This Home
This home is located at 536 6th St, Los Banos, CA 93635 and is currently estimated at $252,528, approximately $375 per square foot. 536 6th St is a home located in Merced County with nearby schools including Los Banos Elementary School, Creekside Junior High School, and Los Banos High School.
Ownership History
Date
Name
Owned For
Owner Type
Purchase Details
Closed on
Oct 7, 2016
Sold by
Laguna Martin J and Laguna Danielle E
Bought by
Laguna Martin J
Current Estimated Value
Home Financials for this Owner
Home Financials are based on the most recent Mortgage that was taken out on this home.
Original Mortgage
$126,400
Interest Rate
3.52%
Mortgage Type
New Conventional
Purchase Details
Closed on
May 7, 2013
Sold by
Laguna Martin J and Laguna Danielle E
Bought by
Laguna Martin J and Laguna Danielle E
Home Financials for this Owner
Home Financials are based on the most recent Mortgage that was taken out on this home.
Original Mortgage
$117,500
Interest Rate
3.38%
Mortgage Type
New Conventional
Purchase Details
Closed on
Jan 9, 2001
Sold by
Laguna Martin Q and Laguna Beatrice
Bought by
Laguna Martin J and Laguna Danielle E
Create a Home Valuation Report for This Property
The Home Valuation Report is an in-depth analysis detailing your home's value as well as a comparison with similar homes in the area
Home Values in the Area
Average Home Value in this Area
Purchase History
| Date | Buyer | Sale Price | Title Company |
|---|---|---|---|
| Laguna Martin J | -- | Title 365 Coraopolis | |
| Laguna Martin J | -- | First American Title Company | |
| Laguna Martin J | -- | -- |
Source: Public Records
Mortgage History
| Date | Status | Borrower | Loan Amount |
|---|---|---|---|
| Closed | Laguna Martin J | $126,400 | |
| Closed | Laguna Martin J | $117,500 |
Source: Public Records
Tax History Compared to Growth
Tax History
| Year | Tax Paid | Tax Assessment Tax Assessment Total Assessment is a certain percentage of the fair market value that is determined by local assessors to be the total taxable value of land and additions on the property. | Land | Improvement |
|---|---|---|---|---|
| 2025 | $304 | $33,489 | $3,938 | $29,551 |
| 2024 | $304 | $32,833 | $3,861 | $28,972 |
| 2023 | $286 | $32,190 | $3,786 | $28,404 |
| 2022 | $279 | $31,560 | $3,712 | $27,848 |
| 2021 | $275 | $30,942 | $3,640 | $27,302 |
| 2020 | $270 | $30,626 | $3,603 | $27,023 |
| 2019 | $264 | $30,027 | $3,533 | $26,494 |
| 2018 | $253 | $29,439 | $3,464 | $25,975 |
| 2017 | $249 | $28,863 | $3,397 | $25,466 |
| 2016 | $250 | $28,298 | $3,331 | $24,967 |
| 2015 | $244 | $27,873 | $3,281 | $24,592 |
| 2014 | $236 | $27,328 | $3,217 | $24,111 |
Source: Public Records
Map
Nearby Homes