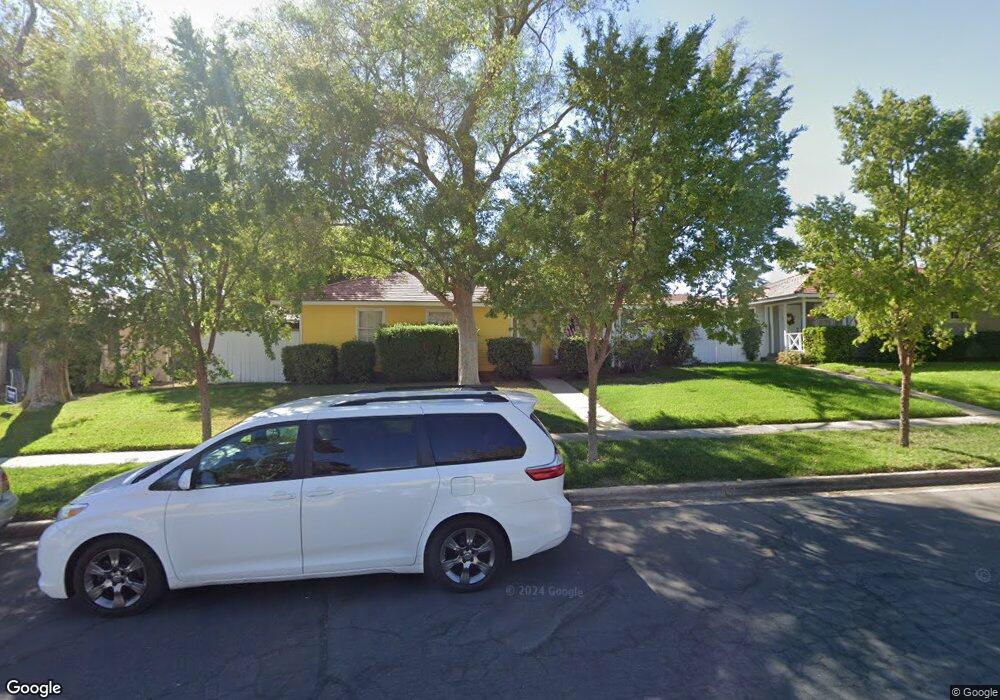
536 Cherry St Boulder City, NV 89005
Estimated Value: $367,000 - $492,000
3
Beds
1
Bath
1,177
Sq Ft
$353/Sq Ft
Est. Value
About This Home
This home is located at 536 Cherry St, Boulder City, NV 89005 and is currently estimated at $415,441, approximately $352 per square foot. 536 Cherry St is a home located in Clark County with nearby schools including Andrew Mitchell Elementary School, Martha P. King Elementary School, and Elton M. & Madelaine E. Garrett Junior High School.
Ownership History
Date
Name
Owned For
Owner Type
Purchase Details
Closed on
Aug 26, 2022
Sold by
West Deborah L
Bought by
Treehouse Trust
Current Estimated Value
Purchase Details
Closed on
May 15, 2002
Sold by
Terrell Thomas M and Terrell Bonnie L
Bought by
West Britton K and West Deborah L
Home Financials for this Owner
Home Financials are based on the most recent Mortgage that was taken out on this home.
Original Mortgage
$130,950
Interest Rate
6.89%
Create a Home Valuation Report for This Property
The Home Valuation Report is an in-depth analysis detailing your home's value as well as a comparison with similar homes in the area
Home Values in the Area
Average Home Value in this Area
Purchase History
| Date | Buyer | Sale Price | Title Company |
|---|---|---|---|
| Treehouse Trust | -- | None Listed On Document | |
| West Britton K | $145,500 | United Title |
Source: Public Records
Mortgage History
| Date | Status | Borrower | Loan Amount |
|---|---|---|---|
| Previous Owner | West Britton K | $130,950 |
Source: Public Records
Tax History
| Year | Tax Paid | Tax Assessment Tax Assessment Total Assessment is a certain percentage of the fair market value that is determined by local assessors to be the total taxable value of land and additions on the property. | Land | Improvement |
|---|---|---|---|---|
| 2026 | $1,193 | $73,316 | $55,650 | $17,666 |
| 2025 | $1,104 | $66,607 | $49,000 | $17,607 |
| 2024 | $1,023 | $66,607 | $49,000 | $17,607 |
| 2023 | $1,023 | $52,614 | $36,750 | $15,864 |
| 2022 | $947 | $47,446 | $33,250 | $14,196 |
| 2021 | $877 | $43,635 | $30,450 | $13,185 |
| 2020 | $814 | $41,528 | $28,700 | $12,828 |
| 2019 | $790 | $38,635 | $26,250 | $12,385 |
| 2018 | $763 | $34,381 | $22,750 | $11,631 |
| 2017 | $849 | $32,520 | $21,000 | $11,520 |
| 2016 | $714 | $27,483 | $15,750 | $11,733 |
| 2015 | $712 | $27,101 | $15,750 | $11,351 |
| 2014 | $698 | $26,803 | $15,750 | $11,053 |
Source: Public Records
Map
Nearby Homes
Your Personal Tour Guide
Ask me questions while you tour the home.