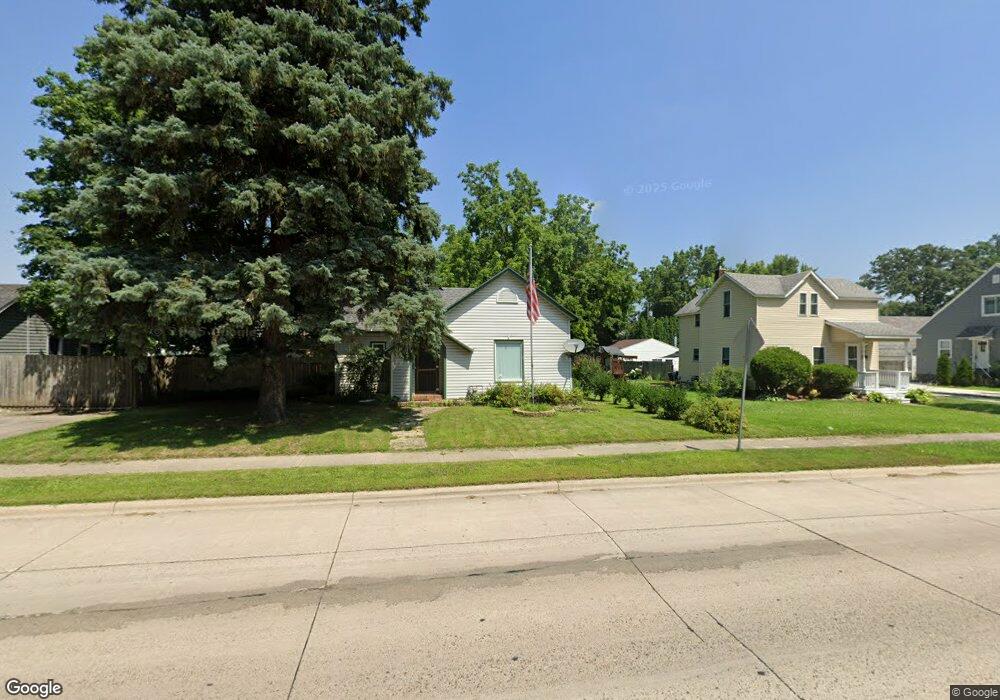
536 E Main St Owatonna, MN 55060
Estimated Value: $171,000 - $222,000
3
Beds
1
Bath
1,054
Sq Ft
$184/Sq Ft
Est. Value
About This Home
This home is located at 536 E Main St, Owatonna, MN 55060 and is currently estimated at $193,535, approximately $183 per square foot. 536 E Main St is a home located in Steele County with nearby schools including Washington Elementary School, Owatonna Middle School, and Owatonna Senior High School.
Ownership History
Date
Name
Owned For
Owner Type
Purchase Details
Closed on
Nov 8, 2016
Sold by
Miller Homes Llc
Bought by
Davis Phillip L
Current Estimated Value
Home Financials for this Owner
Home Financials are based on the most recent Mortgage that was taken out on this home.
Original Mortgage
$5,900
Outstanding Balance
$798
Interest Rate
3.47%
Mortgage Type
New Conventional
Estimated Equity
$192,737
Purchase Details
Closed on
Apr 20, 2016
Sold by
Jp Morgan Chase Bank
Bought by
Miller Homes Llc
Purchase Details
Closed on
Jul 27, 2009
Sold by
Johnson Dennis W and Johnson Susan I
Bought by
Howe Margaret D
Home Financials for this Owner
Home Financials are based on the most recent Mortgage that was taken out on this home.
Original Mortgage
$92,514
Interest Rate
5.62%
Mortgage Type
New Conventional
Create a Home Valuation Report for This Property
The Home Valuation Report is an in-depth analysis detailing your home's value as well as a comparison with similar homes in the area
Home Values in the Area
Average Home Value in this Area
Purchase History
| Date | Buyer | Sale Price | Title Company |
|---|---|---|---|
| Davis Phillip L | $94,900 | On Site Title Llc | |
| Miller Homes Llc | $54,600 | -- | |
| Howe Margaret D | $90,200 | None Available |
Source: Public Records
Mortgage History
| Date | Status | Borrower | Loan Amount |
|---|---|---|---|
| Open | Davis Phillip L | $5,900 | |
| Open | Davis Phillip L | $90,053 | |
| Previous Owner | Howe Margaret D | $92,514 |
Source: Public Records
Tax History
| Year | Tax Paid | Tax Assessment Tax Assessment Total Assessment is a certain percentage of the fair market value that is determined by local assessors to be the total taxable value of land and additions on the property. | Land | Improvement |
|---|---|---|---|---|
| 2025 | $1,798 | $159,200 | $33,600 | $125,600 |
| 2024 | $1,810 | $146,100 | $27,700 | $118,400 |
| 2023 | $1,798 | $138,500 | $27,400 | $111,100 |
| 2022 | $1,642 | $133,200 | $26,000 | $107,200 |
| 2021 | $1,488 | $113,190 | $23,814 | $89,376 |
| 2020 | $1,528 | $104,174 | $23,814 | $80,360 |
| 2019 | $1,240 | $102,704 | $23,814 | $78,890 |
| 2018 | $954 | $92,120 | $20,384 | $71,736 |
| 2017 | $1,234 | $77,224 | $15,582 | $61,642 |
| 2016 | $886 | $67,228 | $15,582 | $51,646 |
| 2015 | -- | $0 | $0 | $0 |
| 2014 | -- | $0 | $0 | $0 |
Source: Public Records
Map
Nearby Homes
- 216 Lincoln Ave
- 551 Agnes St
- 410 E Vine St
- 230 Spruce Ave
- 603 E Academy St
- 315 N Pine Ave
- 331 E Vine St
- 733 E Academy St
- 646 E Rose St
- 609 Harriet Ave
- 234 E School St
- 238 Locust Ave
- 70 Aspen Highland Place
- 430 S Elm Ave
- 246 Willow Ave
- 817 Harriet Ave
- 144 E Rose St
- 562 Maple Dr
- 714 South St
- xxx S Lincoln Ave
- 542 E Main St
- 530 E Main St
- 546 E Main St
- 524 E Main St
- 603 E Broadway St
- 543 E Broadway St
- 554 E Main St
- 518 E Main St
- 609 E Broadway St
- 609 609 Broadway-Street-e
- 537 537 Broadway-Street-e
- 537 E Broadway St
- 537 E Main St
- 615 E Broadway St
- 541 E Main St
- 545 E Main St
- 560 E Main St
- 512 E Main St
- 533 E Broadway St
- 547 E Main St
Your Personal Tour Guide
Ask me questions while you tour the home.