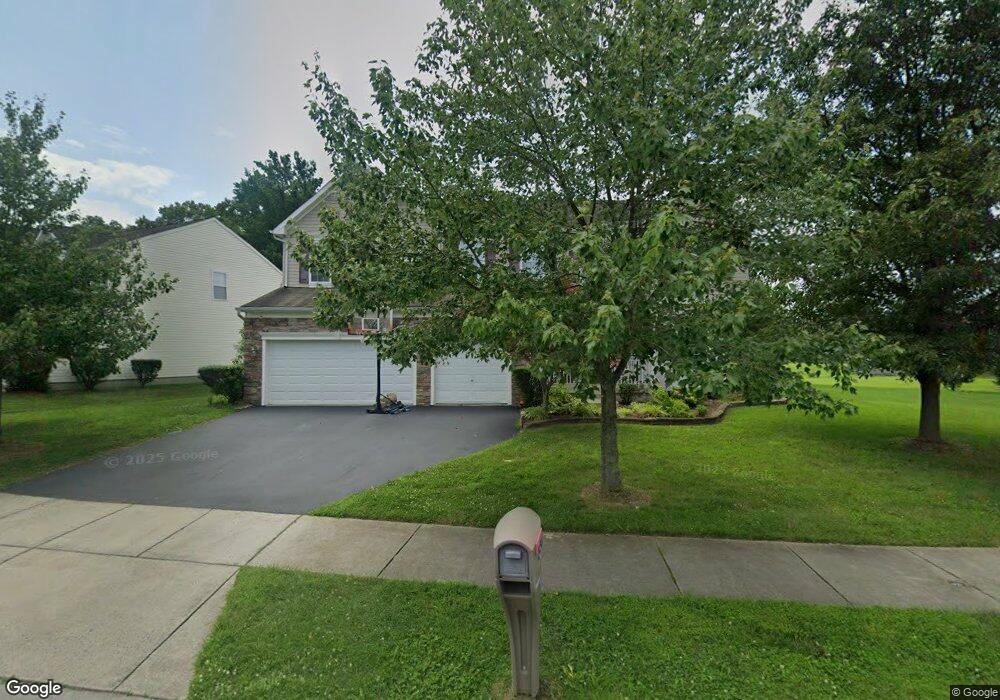
536 Ginn St Townsend, DE 19734
Estimated Value: $553,991 - $591,000
4
Beds
3
Baths
3,117
Sq Ft
$183/Sq Ft
Est. Value
About This Home
This home is located at 536 Ginn St, Townsend, DE 19734 and is currently estimated at $570,748, approximately $183 per square foot. 536 Ginn St is a home located in New Castle County with nearby schools including Townsend Elementary School, Everett Meredith Middle School, and Odessa High School.
Ownership History
Date
Name
Owned For
Owner Type
Purchase Details
Closed on
Dec 8, 2006
Sold by
The Ryland Group Inc
Bought by
Lobdell Scott E and Lobdell Amie N
Current Estimated Value
Home Financials for this Owner
Home Financials are based on the most recent Mortgage that was taken out on this home.
Original Mortgage
$401,400
Interest Rate
9.99%
Mortgage Type
Unknown
Purchase Details
Closed on
Apr 10, 2006
Sold by
Ms Development Co Llc
Bought by
The Ryland Group Inc
Purchase Details
Closed on
Mar 24, 2005
Sold by
Gray Street Properties Llc
Bought by
Townsend Properties Two Llc
Create a Home Valuation Report for This Property
The Home Valuation Report is an in-depth analysis detailing your home's value as well as a comparison with similar homes in the area
Home Values in the Area
Average Home Value in this Area
Purchase History
| Date | Buyer | Sale Price | Title Company |
|---|---|---|---|
| Lobdell Scott E | $422,586 | None Available | |
| The Ryland Group Inc | $2,660,000 | Residential Title & Escrow C | |
| Townsend Properties Two Llc | $1,000 | -- |
Source: Public Records
Mortgage History
| Date | Status | Borrower | Loan Amount |
|---|---|---|---|
| Previous Owner | Lobdell Scott E | $401,400 |
Source: Public Records
Tax History
| Year | Tax Paid | Tax Assessment Tax Assessment Total Assessment is a certain percentage of the fair market value that is determined by local assessors to be the total taxable value of land and additions on the property. | Land | Improvement |
|---|---|---|---|---|
| 2024 | $4,191 | $113,100 | $11,800 | $101,300 |
| 2023 | $3,507 | $113,100 | $11,800 | $101,300 |
| 2022 | $3,502 | $113,100 | $11,800 | $101,300 |
| 2021 | $3,459 | $113,100 | $11,800 | $101,300 |
| 2020 | $3,418 | $113,100 | $11,800 | $101,300 |
| 2019 | $7,244 | $113,100 | $11,800 | $101,300 |
| 2018 | $3,113 | $113,100 | $11,800 | $101,300 |
| 2017 | $2,993 | $113,100 | $11,800 | $101,300 |
| 2016 | $2,701 | $113,100 | $11,800 | $101,300 |
| 2015 | $2,616 | $113,100 | $11,800 | $101,300 |
| 2014 | $2,610 | $113,100 | $11,800 | $101,300 |
Source: Public Records
Map
Nearby Homes
- 3 Barcus Ct
- 100 Karins Blvd
- 308 Gray St
- 412 Main St
- 735 Tracy Cir
- 306 Lattomus St
- 615 Taylor St
- 216 Edgar Rd
- 631 Commerce St
- 4 Brook Ramble Ln
- 422 Bellflower Way Unit CHALFONT PLAN
- 420 Bellflower Way Unit MERION PLAN
- 418 Bellflower Way Unit MONTCHANIN PLAN
- 416 Bellflower Way Unit PENNSBURY PLAN
- 112 Hidden Creek Blvd
- 342 Coralroot Dr
- 341 Coralroot Dr
- 293 Money Rd
- 404 Wiggins Mill Rd
- 6147 Summit Bridge Rd
Your Personal Tour Guide
Ask me questions while you tour the home.