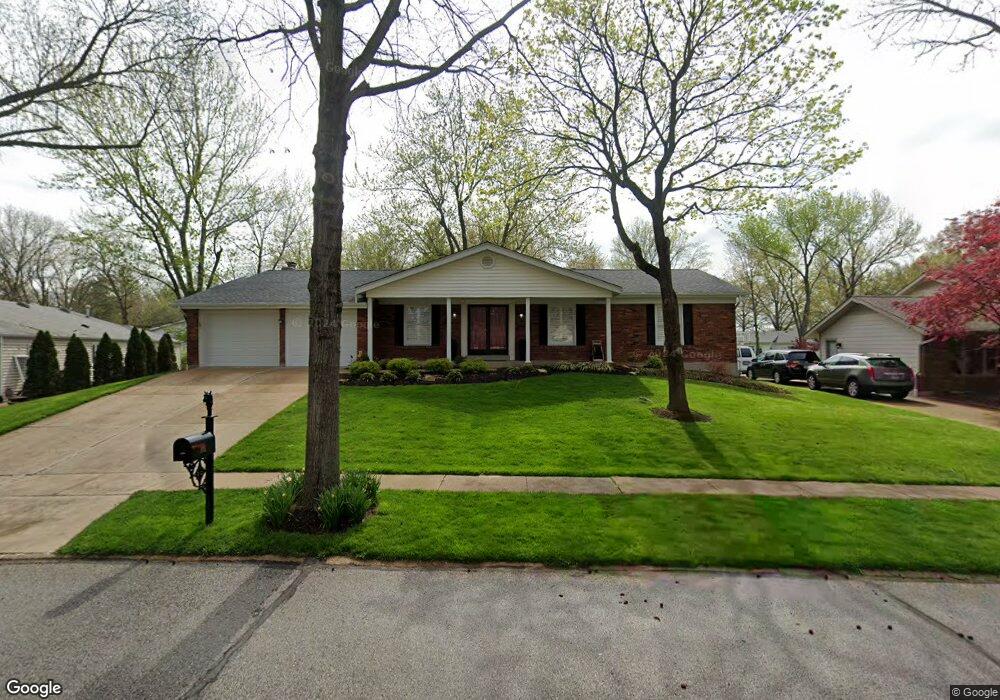
536 Huntercreek Ridge Ct Saint Louis, MO 63131
Estimated Value: $537,000 - $560,000
3
Beds
2
Baths
1,890
Sq Ft
$288/Sq Ft
Est. Value
About This Home
This home is located at 536 Huntercreek Ridge Ct, Saint Louis, MO 63131 and is currently estimated at $544,227, approximately $287 per square foot. 536 Huntercreek Ridge Ct is a home located in St. Louis County with nearby schools including Barretts Elementary School, Parkway South Middle School, and Parkway South High School.
Ownership History
Date
Name
Owned For
Owner Type
Purchase Details
Closed on
Mar 25, 2021
Sold by
Cart Judith Ann
Bought by
Cart Judith Ann and Miller Jean Ann
Current Estimated Value
Purchase Details
Closed on
Mar 23, 2021
Sold by
Cart Judith Ann and Cart Harold E
Bought by
Cart Judith Ann
Purchase Details
Closed on
Jul 25, 2006
Sold by
Cart Harold E and Cart Judith A
Bought by
Cart Harold E and Cart Judith A
Purchase Details
Closed on
Jul 1, 2002
Sold by
Cart Harold E and Cart Judith A
Bought by
Cart Harold E and Harold E Cart Revocable Living Trust
Purchase Details
Closed on
Dec 28, 2001
Sold by
Cart Harold E and Cart Judith A
Bought by
Cart Harold E and Cart Judith A
Purchase Details
Closed on
Dec 9, 1999
Sold by
Foster Judith A
Bought by
Foster Judith A and The Judith A Foster Living Trust
Create a Home Valuation Report for This Property
The Home Valuation Report is an in-depth analysis detailing your home's value as well as a comparison with similar homes in the area
Home Values in the Area
Average Home Value in this Area
Purchase History
| Date | Buyer | Sale Price | Title Company |
|---|---|---|---|
| Cart Judith Ann | -- | None Listed On Document | |
| Cart Judith Ann | -- | None Available | |
| Cart Judith Ann | -- | None Listed On Document | |
| Cart Harold E | -- | None Available | |
| Cart Harold E | -- | -- | |
| Cart Harold E | -- | -- | |
| Foster Judith A | -- | -- |
Source: Public Records
Tax History Compared to Growth
Tax History
| Year | Tax Paid | Tax Assessment Tax Assessment Total Assessment is a certain percentage of the fair market value that is determined by local assessors to be the total taxable value of land and additions on the property. | Land | Improvement |
|---|---|---|---|---|
| 2025 | $4,688 | $97,130 | $48,070 | $49,060 |
| 2024 | $4,688 | $83,410 | $36,970 | $46,440 |
| 2023 | $4,688 | $83,410 | $36,970 | $46,440 |
| 2022 | $4,187 | $68,650 | $33,290 | $35,360 |
| 2021 | $4,153 | $68,650 | $33,290 | $35,360 |
| 2020 | $3,791 | $59,890 | $26,830 | $33,060 |
| 2019 | $3,738 | $59,890 | $26,830 | $33,060 |
| 2018 | $4,070 | $60,310 | $26,830 | $33,480 |
| 2017 | $4,015 | $60,310 | $26,830 | $33,480 |
| 2016 | $3,540 | $50,500 | $26,830 | $23,670 |
| 2015 | $3,730 | $50,500 | $26,830 | $23,670 |
| 2014 | -- | $44,310 | $13,950 | $30,360 |
Source: Public Records
Map
Nearby Homes
- 13124 Huntercreek Ridge Rd
- 13156 Dougherty Ridge Ct
- 2405 Fairoyal Dr
- 12819 Huntercreek Rd
- 2300 E Royal Ct
- 1848 Ridgeview Circle Dr
- 1878 Ridgeview Circle Dr
- 9 Enclave Dr
- 11 Enclave Dr
- 4 Enclave Dr
- 2 Enclave Dr
- 13385 Hiddendale Ln Unit 93
- 2527 Barrett Place Dr
- 2211 Viewroyal Dr
- 2583 Barrett Place Dr
- 467 Tree Top Ln
- 310 Greenbriar Estates Dr
- 309 Greenbriar Estates Dr
- 614 Carman Forest Ln
- 708 Woodmore Oaks Ct
- 530 Huntercreek Ridge Ct
- 13034 Hickory Ridge Ln
- 13028 Hickory Ridge Ln
- 13035 Huntercreek Rd
- 524 Huntercreek Ridge Ct
- 537 Huntercreek Ridge Ct
- 13027 Huntercreek Rd
- 543 Huntercreek Ridge Ct
- 13043 Huntercreek Rd
- 13020 Hickory Ridge Ln
- 531 Huntercreek Ridge Ct
- 554 Huntercreek Ridge Ct
- 13019 Huntercreek Rd
- 549 Huntercreek Ridge Ct
- 516 Huntercreek Ridge Ct
- 525 Huntercreek Ridge Ct
- 13051 Huntercreek Rd
- 13013 Hickory Ridge Ln
- 555 Huntercreek Ridge Ct
- 519 Huntercreek Ridge Ct