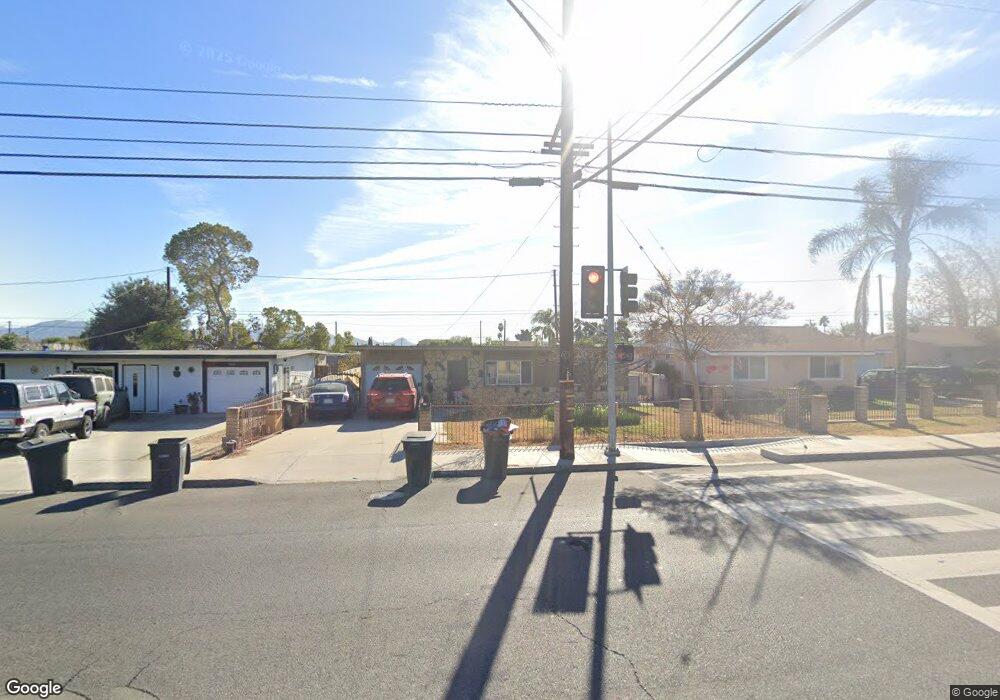
536 Mill St Colton, CA 92324
Estimated Value: $386,000 - $416,000
3
Beds
1
Bath
980
Sq Ft
$406/Sq Ft
Est. Value
About This Home
This home is located at 536 Mill St, Colton, CA 92324 and is currently estimated at $397,926, approximately $406 per square foot. 536 Mill St is a home located in San Bernardino County with nearby schools including William Mckinley Elementary School, Colton Middle School, and Colton High School.
Ownership History
Date
Name
Owned For
Owner Type
Purchase Details
Closed on
May 19, 2024
Sold by
Ridley Elaine D
Bought by
Elaine D Ridley Revocable Living Trust and Ridley
Current Estimated Value
Purchase Details
Closed on
Dec 1, 2015
Sold by
Koch Catherine
Bought by
Koch Charles
Purchase Details
Closed on
Aug 12, 1998
Sold by
Martineau Ronald and Martineau Sandra
Bought by
Rinaldi John David
Home Financials for this Owner
Home Financials are based on the most recent Mortgage that was taken out on this home.
Original Mortgage
$114,452
Interest Rate
6.89%
Mortgage Type
FHA
Purchase Details
Closed on
Aug 2, 1994
Sold by
Ridley James L
Bought by
Ridley James L and Ridley Elaine D
Create a Home Valuation Report for This Property
The Home Valuation Report is an in-depth analysis detailing your home's value as well as a comparison with similar homes in the area
Home Values in the Area
Average Home Value in this Area
Purchase History
| Date | Buyer | Sale Price | Title Company |
|---|---|---|---|
| Elaine D Ridley Revocable Living Trust | -- | None Listed On Document | |
| Koch Charles | -- | First American Title Ins Co | |
| Rinaldi John David | $115,000 | First American Title Ins Co | |
| Ridley James L | -- | -- |
Source: Public Records
Mortgage History
| Date | Status | Borrower | Loan Amount |
|---|---|---|---|
| Previous Owner | Rinaldi John David | $114,452 |
Source: Public Records
Tax History
| Year | Tax Paid | Tax Assessment Tax Assessment Total Assessment is a certain percentage of the fair market value that is determined by local assessors to be the total taxable value of land and additions on the property. | Land | Improvement |
|---|---|---|---|---|
| 2025 | $562 | $49,897 | $9,229 | $40,668 |
| 2024 | $535 | $48,919 | $9,048 | $39,871 |
| 2023 | $535 | $47,960 | $8,871 | $39,089 |
| 2022 | $526 | $47,020 | $8,697 | $38,323 |
| 2021 | $535 | $46,098 | $8,526 | $37,572 |
| 2020 | $536 | $45,626 | $8,439 | $37,187 |
| 2019 | $520 | $44,732 | $8,274 | $36,458 |
| 2018 | $511 | $43,855 | $8,112 | $35,743 |
| 2017 | $492 | $42,995 | $7,953 | $35,042 |
| 2016 | $502 | $42,152 | $7,797 | $34,355 |
| 2015 | $485 | $41,519 | $7,680 | $33,839 |
| 2014 | $468 | $40,706 | $7,530 | $33,176 |
Source: Public Records
Map
Nearby Homes
- 472 Mill St
- 1948 Hunter Rd
- 1844 Alston Ave
- 1734 Kippy Dr
- 2250 W Mill St Unit 19
- 2250 W Mill St Unit 68
- 2250 W Mill #70 St
- 2075 W Rialto Ave Unit 29
- 2075 W Rialto Ave
- 1953 N 8th St
- 494 S Macy St Unit 8
- 494 S Macy St Unit 116
- 1966 W Rialto Ave
- 410 E Citrus St
- 648 San Carlo Ave
- 377 S Mount Vernon Ave
- 1261 N Rancho Ave
- 0 N 8th St Unit RS26030888
- 1354 W King St
- 2686 W Mill St Unit 32
Your Personal Tour Guide
Ask me questions while you tour the home.