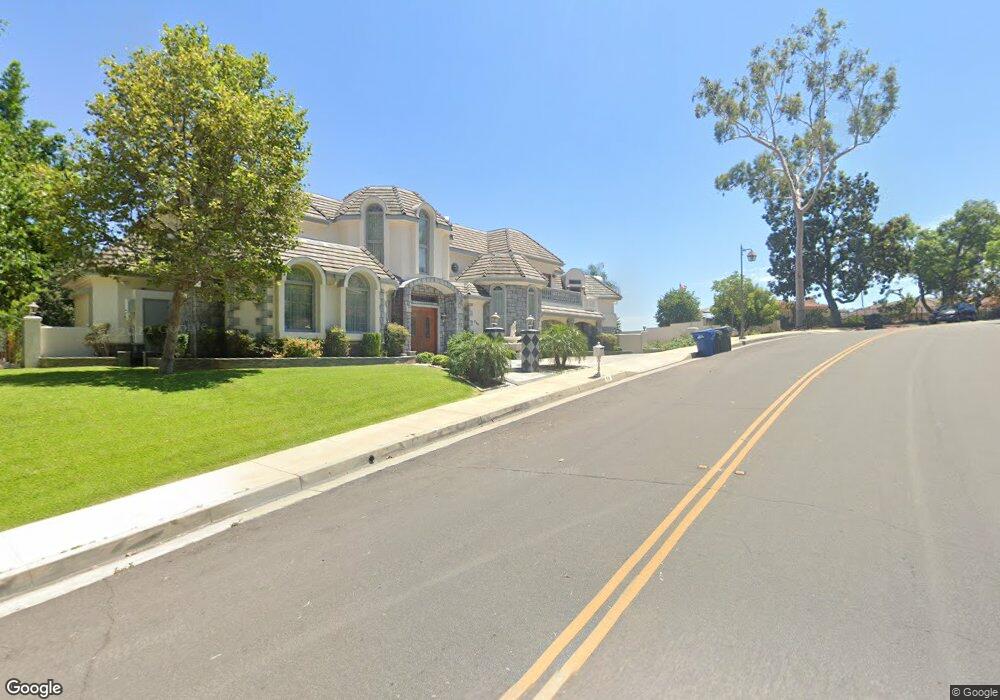
536 N Alta Vista Ave Monrovia, CA 91016
Estimated Value: $2,519,145 - $3,129,000
5
Beds
6
Baths
6,029
Sq Ft
$467/Sq Ft
Est. Value
About This Home
This home is located at 536 N Alta Vista Ave, Monrovia, CA 91016 and is currently estimated at $2,816,786, approximately $467 per square foot. 536 N Alta Vista Ave is a home located in Los Angeles County with nearby schools including Mayflower Elementary School, Clifton Middle School, and Monrovia High School.
Ownership History
Date
Name
Owned For
Owner Type
Purchase Details
Closed on
Jan 10, 2016
Sold by
Shah Ramila
Bought by
The Alta Vista Ii Qualified Personal Res
Current Estimated Value
Purchase Details
Closed on
Feb 8, 2002
Sold by
Shah Md Jaykumar and Shah Jaykumar H
Bought by
Shah Md Jaykumar and Shah Ramila
Home Financials for this Owner
Home Financials are based on the most recent Mortgage that was taken out on this home.
Original Mortgage
$300,700
Interest Rate
7.13%
Create a Home Valuation Report for This Property
The Home Valuation Report is an in-depth analysis detailing your home's value as well as a comparison with similar homes in the area
Home Values in the Area
Average Home Value in this Area
Purchase History
| Date | Buyer | Sale Price | Title Company |
|---|---|---|---|
| The Alta Vista Ii Qualified Personal Res | -- | None Available | |
| Shah Akash | -- | None Available | |
| Shah Md Jaykumar | -- | None Available | |
| Shah Md Jaykumar | -- | First American Title Co |
Source: Public Records
Mortgage History
| Date | Status | Borrower | Loan Amount |
|---|---|---|---|
| Closed | Shah Md Jaykumar | $300,700 |
Source: Public Records
Tax History Compared to Growth
Tax History
| Year | Tax Paid | Tax Assessment Tax Assessment Total Assessment is a certain percentage of the fair market value that is determined by local assessors to be the total taxable value of land and additions on the property. | Land | Improvement |
|---|---|---|---|---|
| 2025 | $18,804 | $1,393,581 | $667,842 | $725,739 |
| 2024 | $18,804 | $1,366,257 | $654,748 | $711,509 |
| 2023 | $18,382 | $1,339,468 | $641,910 | $697,558 |
| 2022 | $17,855 | $1,313,205 | $629,324 | $683,881 |
| 2021 | $17,490 | $1,287,457 | $616,985 | $670,472 |
| 2019 | $16,659 | $1,249,273 | $598,686 | $650,587 |
| 2018 | $16,072 | $1,224,779 | $586,948 | $637,831 |
| 2016 | $15,265 | $1,172,809 | $564,157 | $608,652 |
| 2015 | $14,932 | $1,155,193 | $555,683 | $599,510 |
| 2014 | $14,773 | $1,132,565 | $544,798 | $587,767 |
Source: Public Records
Map
Nearby Homes
- 52 Hidden Valley Rd
- 23 Hidden Valley Rd
- 582 N Alta Vista Ave
- 347 Stedman Place
- 453 N Alta Vista Ave
- 220 W Hillcrest Blvd
- 425 N Canyon Blvd
- 430 N Canyon Blvd
- 375 N Canyon Blvd
- 314 May Ave
- 976 Ridgeside Dr
- 277 Aspen Dr
- 553 Norumbega Dr
- 208 Highland Place
- 411 Sierra Vista Ave
- 235 E Foothill Blvd Unit B
- 116 N Canyon Blvd
- 633 Norumbega Dr
- 700 Norumbega Dr
- 803 Crescent Dr
- 538 N Alta Vista Ave
- 534 N Alta Vista Ave
- 531 N Alta Vista Ave
- 537 N Alta Vista Ave
- 130 Sky Way
- 527 N Alta Vista Ave
- 126 Sky Way
- 528 N Alta Vista Ave
- 539 N Alta Vista Ave
- 525 N Alta Vista Ave
- 102 James Town
- 524 N Alta Vista Ave
- 546 N Alta Vista Ave
- 511 N Myrtle Ave
- 20 Hidden Valley Rd
- 543 N Alta Vista Ave
- 518 N Alta Vista Ave
- 24 Hidden Valley Rd
- 521 N Alta Vista Ave
- 26 Hidden Valley Rd