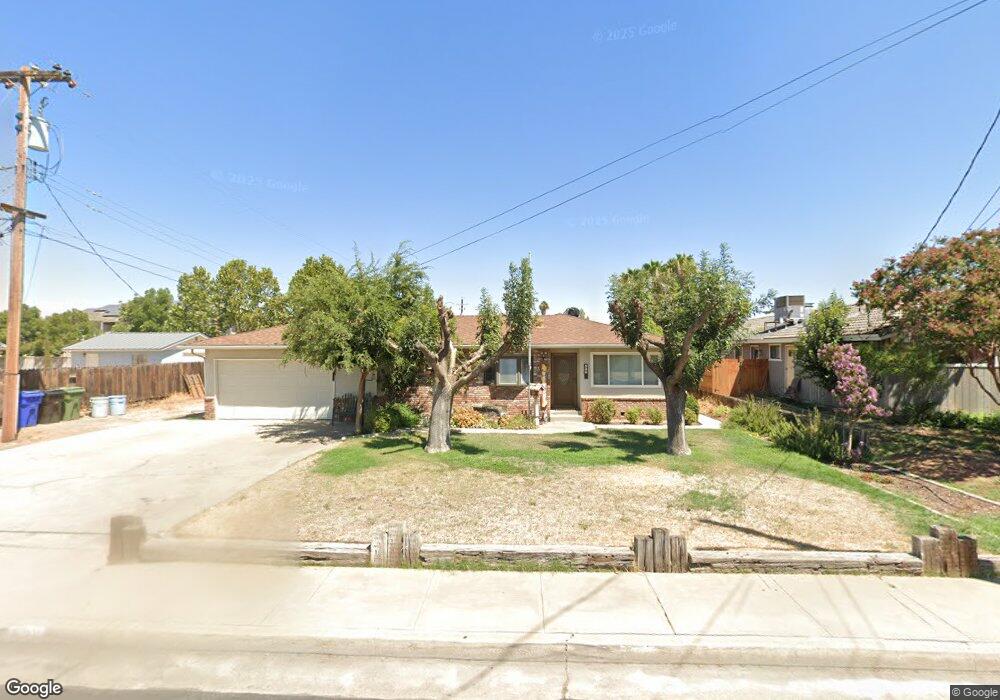
536 N Euclid Ave Dinuba, CA 93618
Estimated Value: $336,000 - $385,000
3
Beds
3
Baths
1,712
Sq Ft
$212/Sq Ft
Est. Value
About This Home
This home is located at 536 N Euclid Ave, Dinuba, CA 93618 and is currently estimated at $363,693, approximately $212 per square foot. 536 N Euclid Ave is a home located in Tulare County with nearby schools including Roosevelt Elementary School, Washington Intermediate School, and Dinuba High School.
Ownership History
Date
Name
Owned For
Owner Type
Purchase Details
Closed on
Sep 27, 2016
Sold by
Babboni Lynn Marie
Bought by
Babboni Jed Eliot
Current Estimated Value
Home Financials for this Owner
Home Financials are based on the most recent Mortgage that was taken out on this home.
Original Mortgage
$227,171
Outstanding Balance
$181,630
Interest Rate
3.46%
Mortgage Type
New Conventional
Estimated Equity
$182,063
Purchase Details
Closed on
Sep 7, 2016
Sold by
Dahlgren William R
Bought by
Babboni Jed Eliot
Home Financials for this Owner
Home Financials are based on the most recent Mortgage that was taken out on this home.
Original Mortgage
$227,171
Outstanding Balance
$181,630
Interest Rate
3.46%
Mortgage Type
New Conventional
Estimated Equity
$182,063
Purchase Details
Closed on
Apr 20, 2006
Sold by
City Of Dinuba
Bought by
Dahlgren William R and Dahlgren Patricia J
Purchase Details
Closed on
Dec 30, 1997
Sold by
Dahlgren William R
Bought by
Davis Betty Lou
Purchase Details
Closed on
Oct 30, 1997
Sold by
Dahlgren William R
Bought by
Dahlgren William R and Dahlgren Patricia J
Purchase Details
Closed on
Sep 16, 1994
Sold by
Dahlgren William R
Bought by
Dahlgren William Richard and Dahlgren Patricia Jean
Create a Home Valuation Report for This Property
The Home Valuation Report is an in-depth analysis detailing your home's value as well as a comparison with similar homes in the area
Home Values in the Area
Average Home Value in this Area
Purchase History
| Date | Buyer | Sale Price | Title Company |
|---|---|---|---|
| Babboni Jed Eliot | -- | Chicago Title Company | |
| Babboni Jed Eliot | $225,000 | Chicago Title Company | |
| Dahlgren William R | -- | None Available | |
| Davis Betty Lou | $94,500 | -- | |
| Dahlgren William R | -- | -- | |
| Davis Betty Lou | -- | -- | |
| Dahlgren William R | -- | -- | |
| Dahlgren William Richard | -- | -- |
Source: Public Records
Mortgage History
| Date | Status | Borrower | Loan Amount |
|---|---|---|---|
| Open | Babboni Jed Eliot | $227,171 |
Source: Public Records
Tax History Compared to Growth
Tax History
| Year | Tax Paid | Tax Assessment Tax Assessment Total Assessment is a certain percentage of the fair market value that is determined by local assessors to be the total taxable value of land and additions on the property. | Land | Improvement |
|---|---|---|---|---|
| 2025 | $2,850 | $260,548 | $55,706 | $204,842 |
| 2024 | $2,850 | $255,440 | $54,614 | $200,826 |
| 2023 | $2,817 | $250,433 | $53,544 | $196,889 |
| 2022 | $2,688 | $245,524 | $52,495 | $193,029 |
| 2021 | $2,620 | $240,710 | $51,466 | $189,244 |
| 2020 | $2,670 | $238,242 | $50,938 | $187,304 |
| 2019 | $2,702 | $233,570 | $49,939 | $183,631 |
| 2018 | $2,617 | $228,990 | $48,960 | $180,030 |
| 2017 | $2,598 | $224,500 | $48,000 | $176,500 |
| 2016 | $1,271 | $119,611 | $31,934 | $87,677 |
| 2015 | $1,269 | $117,814 | $31,454 | $86,360 |
| 2014 | $1,208 | $115,506 | $30,838 | $84,668 |
Source: Public Records
Map
Nearby Homes
- 616 W Bloomingdale Ave
- 1266 N Skye St Unit Mb90
- 0 Avenue 424
- 0 Road 80
- 1177 Timothy Ave
- 976 Daisy Ct
- 784/784a N Lillie Ave
- 333 N L St
- 375 Amber Ln
- 397 Amber Ln
- 1401 N Nichols Ave
- 1237 Chestnut Ln
- 371 Village Dr
- 785 E Saginaw Ave
- 223 N H St
- 605 E Davis Dr
- 225 W Tulare St
- 789 E Millwood Dr
- 299 Alder St
- MB90 N Skye St
- 520 N Euclid Ave
- 489 W North Way
- 580 N Euclid Ave
- 477 W North Way
- 516 W Bloomingdale Ave
- 531 N Euclid Ave
- 592 N Euclid Ave
- 451 W North Way
- 480 N Euclid Ave
- 534 W Bloomingdale Ave
- 456 W North Way
- 551 W North Way
- 435 W North Way
- 517 W Bloomingdale Ave
- 485 N Euclid Ave
- 554 W Bloomingdale Ave
- 551 N Way
- 389 W North Way
- 432 W North Way
- 535 W Bloomingdale Ave