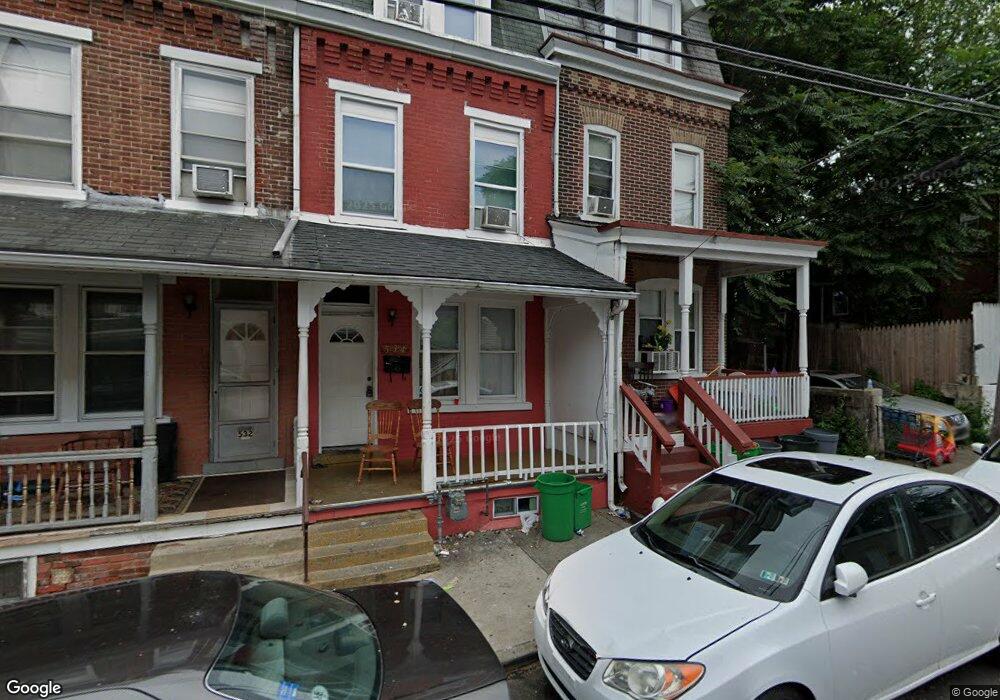
536 N Penn St Allentown, PA 18102
Center City NeighborhoodEstimated Value: $169,000 - $197,000
5
Beds
1
Bath
1,659
Sq Ft
$111/Sq Ft
Est. Value
About This Home
This home is located at 536 N Penn St, Allentown, PA 18102 and is currently estimated at $184,330, approximately $111 per square foot. 536 N Penn St is a home located in Lehigh County with nearby schools including Huntington Elementary School, Central Elementary School, and San Rafael Junior High School.
Ownership History
Date
Name
Owned For
Owner Type
Purchase Details
Closed on
Dec 14, 2005
Sold by
Tri County Development Llc
Bought by
Whitworth John H and Whitworth Sarah A
Current Estimated Value
Purchase Details
Closed on
Apr 7, 2005
Sold by
County Of Lehigh
Bought by
Tri County Development Llc
Purchase Details
Closed on
May 30, 1984
Sold by
Dunbar Spurgeon
Bought by
Baumann Thomas R and Baumann Shirley A
Create a Home Valuation Report for This Property
The Home Valuation Report is an in-depth analysis detailing your home's value as well as a comparison with similar homes in the area
Home Values in the Area
Average Home Value in this Area
Purchase History
| Date | Buyer | Sale Price | Title Company |
|---|---|---|---|
| Whitworth John H | $57,876 | None Available | |
| Tri County Development Llc | $33,000 | -- | |
| Baumann Thomas R | $9,900 | -- |
Source: Public Records
Tax History Compared to Growth
Tax History
| Year | Tax Paid | Tax Assessment Tax Assessment Total Assessment is a certain percentage of the fair market value that is determined by local assessors to be the total taxable value of land and additions on the property. | Land | Improvement |
|---|---|---|---|---|
| 2025 | $1,915 | $59,300 | $4,400 | $54,900 |
| 2024 | $1,915 | $59,300 | $4,400 | $54,900 |
| 2023 | $1,915 | $59,300 | $4,400 | $54,900 |
| 2022 | $1,847 | $59,300 | $54,900 | $4,400 |
| 2021 | $1,810 | $59,300 | $4,400 | $54,900 |
| 2020 | $1,763 | $59,300 | $4,400 | $54,900 |
| 2019 | $1,734 | $59,300 | $4,400 | $54,900 |
| 2018 | $1,620 | $59,300 | $4,400 | $54,900 |
| 2017 | $1,579 | $59,300 | $4,400 | $54,900 |
| 2016 | -- | $59,300 | $4,400 | $54,900 |
| 2015 | -- | $59,300 | $4,400 | $54,900 |
| 2014 | -- | $59,300 | $4,400 | $54,900 |
Source: Public Records
Map
Nearby Homes
- 514 N 5th St
- 454 W Liberty St
- 419 W Liberty St
- 424 W Liberty St
- 416 N 5th St
- 407 N 5th St
- 440 N 4th St
- 527 N 6th St
- 448 W Gordon St
- 526 W Gordon St Unit 1
- 504 W Tilghman St
- 522 N Jordan St
- 508 Park St
- 612 Page St
- 418 N Jordan St
- 431 Tilghman St
- 414 N Church St
- 627 W Allen St
- 643 N 4th St
- 620 Park St