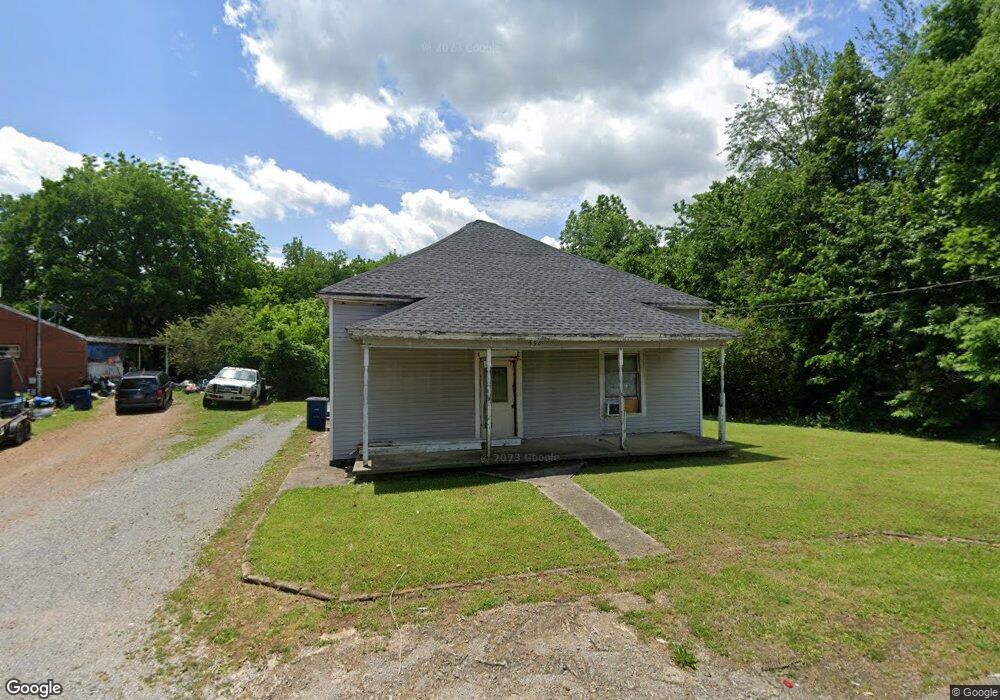
536 Oak St Shelbyville, TN 37160
Estimated Value: $35,011 - $204,000
3
Beds
1
Bath
1,240
Sq Ft
$116/Sq Ft
Est. Value
About This Home
This home is located at 536 Oak St, Shelbyville, TN 37160 and is currently estimated at $144,003, approximately $116 per square foot. 536 Oak St is a home located in Bedford County with nearby schools including East Side Elementary School, Harris Middle School, and Christian Chapel Academy.
Ownership History
Date
Name
Owned For
Owner Type
Purchase Details
Closed on
Dec 13, 2016
Sold by
Allen James W
Bought by
Boles Paul
Current Estimated Value
Purchase Details
Closed on
Dec 9, 2010
Sold by
Patterson Gary
Bought by
Allen James W
Purchase Details
Closed on
Sep 3, 2004
Sold by
Bomar Joe D
Bought by
Patterson Gary
Home Financials for this Owner
Home Financials are based on the most recent Mortgage that was taken out on this home.
Original Mortgage
$21,250
Interest Rate
6.01%
Purchase Details
Closed on
Aug 26, 1992
Bought by
Bomar Joe D
Purchase Details
Closed on
Jun 5, 1961
Bought by
Jobe Jobe J and Jobe Jewell
Create a Home Valuation Report for This Property
The Home Valuation Report is an in-depth analysis detailing your home's value as well as a comparison with similar homes in the area
Home Values in the Area
Average Home Value in this Area
Purchase History
| Date | Buyer | Sale Price | Title Company |
|---|---|---|---|
| Boles Paul | $15,500 | -- | |
| Allen James W | $17,600 | -- | |
| Patterson Gary | $25,000 | -- | |
| Bomar Joe D | $28,500 | -- | |
| Jobe Jobe J | -- | -- |
Source: Public Records
Mortgage History
| Date | Status | Borrower | Loan Amount |
|---|---|---|---|
| Previous Owner | Jobe Jobe J | $21,250 |
Source: Public Records
Tax History Compared to Growth
Tax History
| Year | Tax Paid | Tax Assessment Tax Assessment Total Assessment is a certain percentage of the fair market value that is determined by local assessors to be the total taxable value of land and additions on the property. | Land | Improvement |
|---|---|---|---|---|
| 2025 | -- | $12,850 | $0 | $0 |
| 2024 | -- | $12,850 | $4,925 | $7,925 |
| 2023 | $190 | $12,850 | $4,925 | $7,925 |
| 2022 | $503 | $12,850 | $4,925 | $7,925 |
| 2021 | $457 | $12,850 | $4,925 | $7,925 |
| 2020 | $360 | $12,850 | $4,925 | $7,925 |
| 2019 | $360 | $8,125 | $2,625 | $5,500 |
| 2018 | $352 | $8,125 | $2,625 | $5,500 |
| 2017 | $352 | $8,125 | $2,625 | $5,500 |
| 2016 | $381 | $8,875 | $2,625 | $6,250 |
| 2015 | $381 | $8,875 | $2,625 | $6,250 |
| 2014 | $340 | $8,684 | $0 | $0 |
Source: Public Records
Map
Nearby Homes
- 120 Dogwood Ct
- 709 Belmont Ave
- 222 Carter St
- 102 Germantown Rd
- 220 Walnut St
- 215 Coney Island Rd
- 211 S Fairoak St
- 0 E Depot St
- 112 Elizabeth St
- 207 Martha St
- 314 Maplewood Dr
- 464 Whitthorne St
- 627 E Lane St
- 631 E Lane St
- 107 Rockwood Dr
- 418 Riverview Dr
- 527 Deery St
- 611 Coble Cir
- 508 Lewis Ave
- 713 King Ave