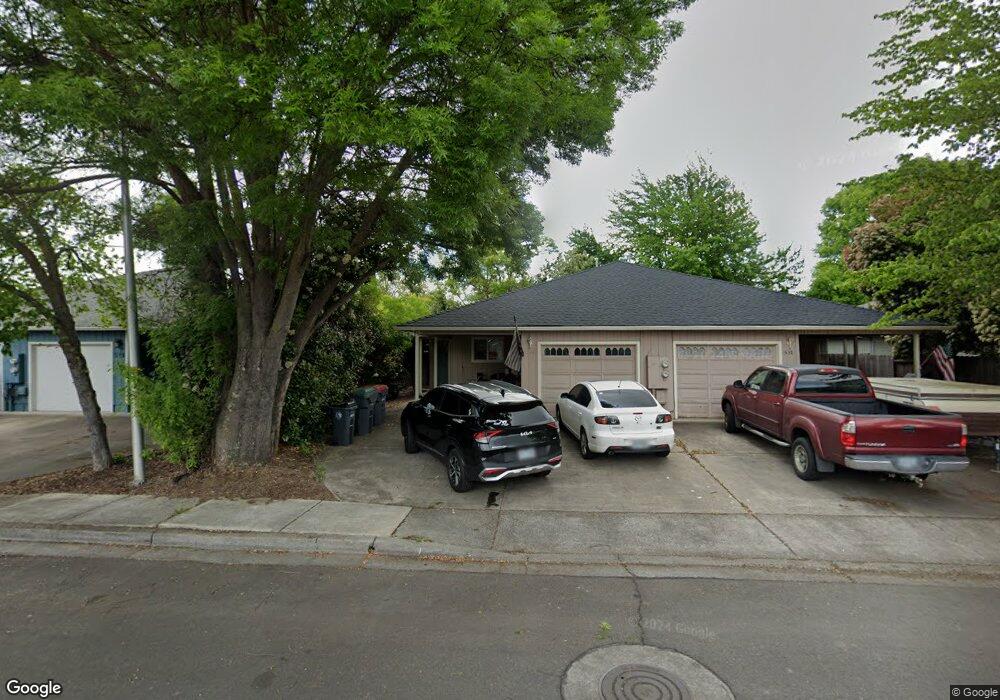
536 Primrose Dr Central Point, OR 97502
Estimated Value: $425,150 - $540,000
4
Beds
4
Baths
2,064
Sq Ft
$231/Sq Ft
Est. Value
About This Home
This home is located at 536 Primrose Dr, Central Point, OR 97502 and is currently estimated at $476,538, approximately $230 per square foot. 536 Primrose Dr is a home located in Jackson County with nearby schools including Central Point Elementary School, Scenic Middle School, and Crater High School.
Ownership History
Date
Name
Owned For
Owner Type
Purchase Details
Closed on
Sep 18, 2018
Sold by
Ladavis James La
Bought by
Ge David Holdings Llc
Current Estimated Value
Purchase Details
Closed on
Nov 2, 2009
Sold by
Davis James L
Bought by
Davis James L A and James L A Davis Trust
Purchase Details
Closed on
Aug 15, 2009
Sold by
Davis James L
Bought by
Davis James L
Purchase Details
Closed on
Aug 9, 2008
Sold by
Davis James L
Bought by
Davis James L and Jaslow Surviving Trust
Purchase Details
Closed on
Jul 10, 2001
Sold by
Jaslow Franklyn and Jaslow Tae A
Bought by
Franklyn & Tae A Jaslow Revocable Trust
Purchase Details
Closed on
Jun 15, 2001
Sold by
Jaslow Franklin and Jaslow Tae A
Bought by
Jaslow Franklyn and Jaslow Tae A
Purchase Details
Closed on
Mar 12, 1998
Sold by
Franklyn Jaslow and Franklyn Tae
Bought by
Jaslow Franklin and Jaslow Tae A
Create a Home Valuation Report for This Property
The Home Valuation Report is an in-depth analysis detailing your home's value as well as a comparison with similar homes in the area
Purchase History
| Date | Buyer | Sale Price | Title Company |
|---|---|---|---|
| Ge David Holdings Llc | -- | None Available | |
| Davis James L A | -- | None Available | |
| Davis James L | -- | None Available | |
| Davis James L | -- | None Available | |
| Davis James L | -- | None Available | |
| Franklyn & Tae A Jaslow Revocable Trust | -- | -- | |
| Jaslow Franklyn | -- | Lawyers Title Insurance Corp | |
| Jaslow Franklin | -- | -- | |
| Jaslow Franklin | -- | -- |
Source: Public Records
Tax History
| Year | Tax Paid | Tax Assessment Tax Assessment Total Assessment is a certain percentage of the fair market value that is determined by local assessors to be the total taxable value of land and additions on the property. | Land | Improvement |
|---|---|---|---|---|
| 2026 | $5,409 | $319,570 | $134,000 | $185,570 |
| 2025 | $5,276 | $317,340 | $102,990 | $214,350 |
| 2024 | $5,276 | $308,100 | $100,000 | $208,100 |
| 2023 | $5,106 | $299,130 | $97,080 | $202,050 |
| 2022 | $4,987 | $299,130 | $97,080 | $202,050 |
| 2021 | $4,845 | $290,420 | $94,250 | $196,170 |
| 2020 | $4,703 | $281,970 | $91,500 | $190,470 |
| 2019 | $4,587 | $265,790 | $86,240 | $179,550 |
| 2018 | $4,447 | $258,050 | $83,730 | $174,320 |
| 2017 | $4,336 | $258,050 | $83,730 | $174,320 |
| 2016 | $4,209 | $243,250 | $78,930 | $164,320 |
| 2015 | $4,033 | $243,250 | $78,930 | $164,320 |
| 2014 | $3,930 | $229,300 | $74,400 | $154,900 |
Source: Public Records
Map
Nearby Homes
- 512 Village Dr Unit B5
- 533 Brittni Ln
- 906 Brandi Way
- 943 Hopkins Rd
- 934 Pittview Ave
- 301 Freeman Rd Unit 30
- 301 Freeman Rd Unit 92
- 301 Freeman Rd Unit 91
- 301 Freeman Rd Unit 90
- 1025 Fairfield Ave
- 555 Freeman Rd Unit 73
- 555 Freeman Rd Unit 254
- 555 Freeman Rd Unit 105
- 555 Freeman Rd Unit 209
- 230 Peninger Rd
- 647 Shadow Way
- 3364 Bursell Rd
- 1204 Heather Ln
- 850 Forest Glen Dr
- 450 Freeman Rd
- 546 Primrose Dr
- 526 Primrose Dr
- 531 Mountain View 533 Dr
- 531 Mountain View Dr
- 541 Mountain View 543 Dr
- 521 Mountain View 523 Dr
- 541 Mountain View Dr
- 521 Mountain View Dr
- 566 Primrose Dr
- 543 Mountain View Dr
- 516 Primrose Dr
- 511 Mountain View 513 Dr
- 551 Mountain View Dr
- 533 Primrose Dr
- 511 Mountain View Dr
- 543 Primrose Dr
- 523 Primrose Dr
- 553 Mountain View Dr
- 503 Mountain View Dr
- 576 Primrose Dr
Your Personal Tour Guide
Ask me questions while you tour the home.