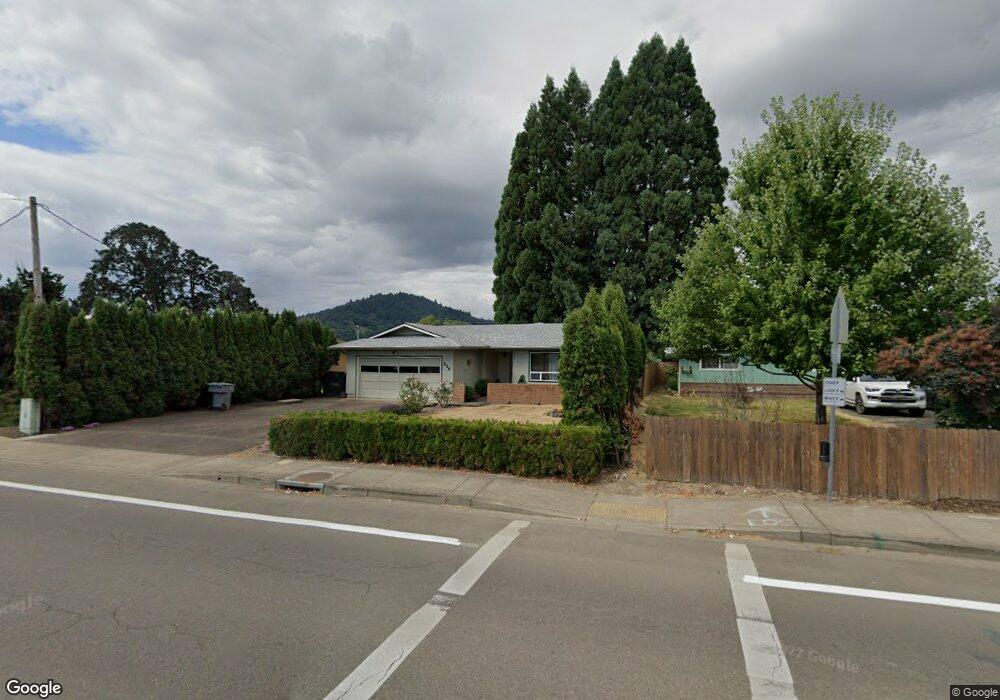
536 S 19th St Philomath, OR 97370
Estimated Value: $370,000 - $433,000
3
Beds
2
Baths
1,179
Sq Ft
$344/Sq Ft
Est. Value
About This Home
This home is located at 536 S 19th St, Philomath, OR 97370 and is currently estimated at $406,147, approximately $344 per square foot. 536 S 19th St is a home located in Benton County with nearby schools including Clemens Primary School, Philomath Elementary School, and Philomath Middle School.
Ownership History
Date
Name
Owned For
Owner Type
Purchase Details
Closed on
May 21, 2025
Sold by
Cantrell Kenneth L
Bought by
Cantrell Kenneth L and Cantrell Marcia K
Current Estimated Value
Purchase Details
Closed on
Aug 13, 2010
Sold by
Cantrell Brian D
Bought by
Cantrell Brian D
Home Financials for this Owner
Home Financials are based on the most recent Mortgage that was taken out on this home.
Original Mortgage
$158,180
Interest Rate
3.86%
Mortgage Type
FHA
Purchase Details
Closed on
Jan 5, 2004
Sold by
Hall Janene R
Bought by
Cantrell Brian D
Home Financials for this Owner
Home Financials are based on the most recent Mortgage that was taken out on this home.
Original Mortgage
$118,400
Interest Rate
5.86%
Mortgage Type
Purchase Money Mortgage
Purchase Details
Closed on
Dec 14, 2001
Sold by
The Chase Manhattan Bank
Bought by
Hall Janene R
Home Financials for this Owner
Home Financials are based on the most recent Mortgage that was taken out on this home.
Original Mortgage
$113,975
Interest Rate
6.39%
Purchase Details
Closed on
Feb 26, 2001
Sold by
Cook Stephen B and Cook Nancy L
Bought by
The Chase Manhattan Bank
Purchase Details
Closed on
Jun 19, 1991
Bought by
Cenlar Federal Savings Bank
Create a Home Valuation Report for This Property
The Home Valuation Report is an in-depth analysis detailing your home's value as well as a comparison with similar homes in the area
Home Values in the Area
Average Home Value in this Area
Purchase History
| Date | Buyer | Sale Price | Title Company |
|---|---|---|---|
| Cantrell Kenneth L | -- | None Listed On Document | |
| Cantrell Kenneth L | -- | None Listed On Document | |
| Cantrell Brian D | -- | None Available | |
| Cantrell Brian D | $148,000 | Ticor Title | |
| Hall Janene R | $117,500 | First American Title | |
| The Chase Manhattan Bank | $98,000 | Key Title Company | |
| Cenlar Federal Savings Bank | $64,500 | -- |
Source: Public Records
Mortgage History
| Date | Status | Borrower | Loan Amount |
|---|---|---|---|
| Previous Owner | Cantrell Brian D | $158,180 | |
| Previous Owner | Cantrell Brian D | $118,400 | |
| Previous Owner | Hall Janene R | $113,975 | |
| Closed | Cantrell Brian D | $29,600 |
Source: Public Records
Tax History
| Year | Tax Paid | Tax Assessment Tax Assessment Total Assessment is a certain percentage of the fair market value that is determined by local assessors to be the total taxable value of land and additions on the property. | Land | Improvement |
|---|---|---|---|---|
| 2025 | $4,513 | $223,227 | -- | -- |
| 2024 | $4,513 | $216,725 | -- | -- |
| 2023 | $4,277 | $210,413 | $0 | $0 |
| 2022 | $4,153 | $204,284 | $0 | $0 |
| 2021 | $4,023 | $198,334 | $0 | $0 |
| 2020 | $4,060 | $192,557 | $0 | $0 |
| 2019 | $3,769 | $186,949 | $0 | $0 |
| 2018 | $3,768 | $181,504 | $0 | $0 |
| 2017 | $3,645 | $176,217 | $0 | $0 |
| 2016 | $3,421 | $171,084 | $0 | $0 |
| 2015 | $3,171 | $166,101 | $0 | $0 |
| 2014 | $3,054 | $161,263 | $0 | $0 |
| 2012 | -- | $152,006 | $0 | $0 |
Source: Public Records
Map
Nearby Homes
- 1505 Willow Ln
- 760 S 16th St
- 1717 Main St
- 783 S 15th St
- 2148 Main St
- 355 N 13th St
- 815 Applegate St Unit Lot 1
- 815 Applegate St Unit 1 St
- 990 Pippa Ln
- 407 S 30th St
- 714 Grouse Place
- 502 N 8th St Unit 17 St
- 769 N 9th St
- 791 Quail Glenn Dr
- 1284 N 19th St Unit 92 St
- 538 Starlight Way
- 3425 Southwood Dr
- 609 Coastal View Dr (Lan
- 31970 Fern Rd
- 5935 SW Philomath Bl
Your Personal Tour Guide
Ask me questions while you tour the home.