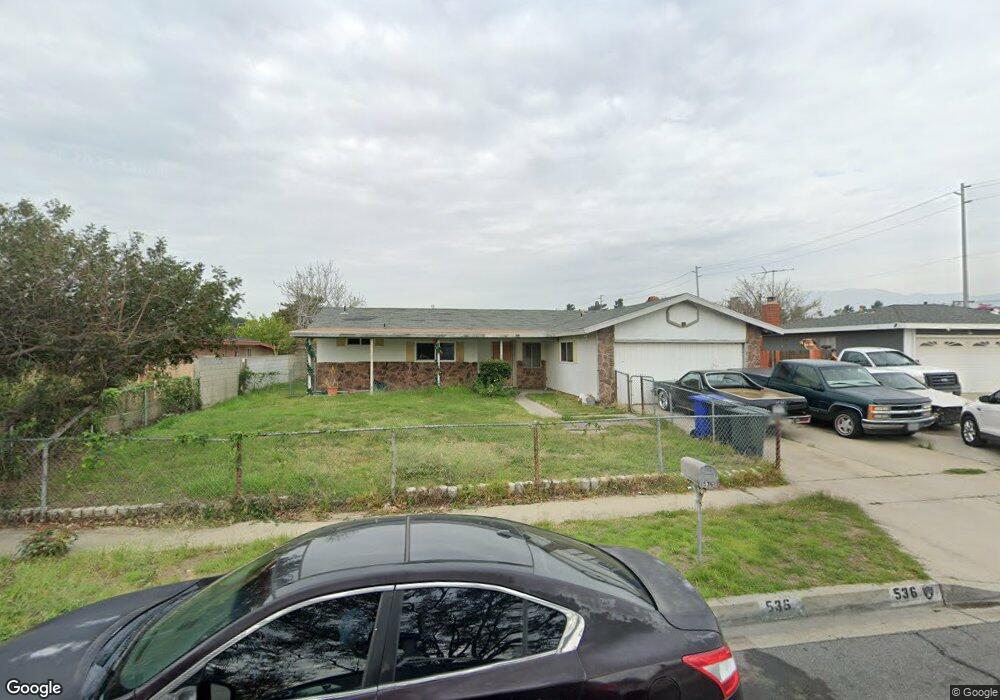
536 S Ironwood Ave Bloomington, CA 92316
Estimated Value: $511,000 - $595,000
3
Beds
2
Baths
1,200
Sq Ft
$447/Sq Ft
Est. Value
About This Home
This home is located at 536 S Ironwood Ave, Bloomington, CA 92316 and is currently estimated at $536,681, approximately $447 per square foot. 536 S Ironwood Ave is a home located in San Bernardino County with nearby schools including Maple Elementary School, Alder Middle School, and Jurupa Hills High School.
Ownership History
Date
Name
Owned For
Owner Type
Purchase Details
Closed on
Oct 21, 2003
Sold by
Garcia Gonzalo
Bought by
Bush Kevin
Current Estimated Value
Purchase Details
Closed on
Dec 17, 2002
Sold by
Nunez Maria T
Bought by
Garcia Gonzalo
Purchase Details
Closed on
Mar 5, 2001
Sold by
Aguirre Jose E and Aguirre Mildreth X
Bought by
Nunez Maria Teresa
Home Financials for this Owner
Home Financials are based on the most recent Mortgage that was taken out on this home.
Original Mortgage
$88,270
Interest Rate
6.97%
Purchase Details
Closed on
Dec 7, 1995
Sold by
Hud
Bought by
Aguirre Jose E and Aguirre Mildreth X
Home Financials for this Owner
Home Financials are based on the most recent Mortgage that was taken out on this home.
Original Mortgage
$69,693
Interest Rate
7.37%
Mortgage Type
FHA
Purchase Details
Closed on
Jul 10, 1995
Sold by
Bulf Kenneth L and Bulf Sherri L
Bought by
Commercial Center Bank
Purchase Details
Closed on
Mar 15, 1995
Sold by
Commercial Center Bank
Bought by
Hud
Create a Home Valuation Report for This Property
The Home Valuation Report is an in-depth analysis detailing your home's value as well as a comparison with similar homes in the area
Home Values in the Area
Average Home Value in this Area
Purchase History
| Date | Buyer | Sale Price | Title Company |
|---|---|---|---|
| Bush Kevin | -- | -- | |
| Bush Kevin | $10,000 | -- | |
| Garcia Gonzalo | -- | -- | |
| Nunez Maria Teresa | $91,000 | American Title Co | |
| Aguirre Jose E | $71,000 | Gateway Title Company | |
| Commercial Center Bank | $117,435 | Fidelity National Title Ins | |
| Hud | -- | American Title |
Source: Public Records
Mortgage History
| Date | Status | Borrower | Loan Amount |
|---|---|---|---|
| Previous Owner | Nunez Maria Teresa | $88,270 | |
| Previous Owner | Aguirre Jose E | $69,693 |
Source: Public Records
Tax History Compared to Growth
Tax History
| Year | Tax Paid | Tax Assessment Tax Assessment Total Assessment is a certain percentage of the fair market value that is determined by local assessors to be the total taxable value of land and additions on the property. | Land | Improvement |
|---|---|---|---|---|
| 2025 | $3,361 | $272,988 | $68,248 | $204,740 |
| 2024 | $3,361 | $267,635 | $66,910 | $200,725 |
| 2023 | $3,285 | $262,387 | $65,598 | $196,789 |
| 2022 | $3,151 | $257,242 | $64,312 | $192,930 |
| 2021 | $3,116 | $252,198 | $63,051 | $189,147 |
| 2020 | $3,099 | $249,612 | $62,404 | $187,208 |
| 2019 | $3,017 | $244,717 | $61,180 | $183,537 |
| 2018 | $3,036 | $239,918 | $59,980 | $179,938 |
| 2017 | $3,021 | $235,214 | $58,804 | $176,410 |
| 2016 | $2,638 | $230,602 | $57,651 | $172,951 |
| 2015 | $2,524 | $220,000 | $77,000 | $143,000 |
| 2014 | $2,449 | $209,000 | $73,000 | $136,000 |
Source: Public Records
Map
Nearby Homes
- 1510 W Merrill Ave
- 1560 W Athol St
- 1459 W James St
- 9050 Dumond Dr
- 806 S Sandalwood Ave
- 18264 Pine Ave Unit a & B
- 18264 Pine Ave
- 18239 Orange Way
- 8795 Frankfort St
- 1157 W Orchard St
- 17962 Merrill Ave
- 18100 Arrow Blvd
- 8560 Buckeye Dr
- 18013 Arrow Blvd
- 17903 Dorsey Way
- 1228 W Woodcrest St
- 250 N Linden Ave Unit 57
- 250 N Linden Ave Unit 9
- 250 N Linden Ave Unit 124
- 250 N Linden Ave Unit 327
- 546 S Ironwood Ave
- 526 S Ironwood Ave
- 535 S Sandalwood Ave
- 525 S Sandalwood Ave
- 545 S Sandalwood Ave
- 556 S Ironwood Ave
- 516 S Ironwood Ave
- 535 S Ironwood Ave
- 545 S Ironwood Ave
- 555 S Sandalwood Ave
- 525 S Ironwood Ave
- 515 S Sandalwood Ave
- 555 S Ironwood Ave
- 1550 W Carter St
- 515 S Ironwood Ave
- 1564 W Carter St
- 536 S Linden Ave
- 536 S Sandalwood Ave
- 546 S Linden Ave
- 1526 W Carter St