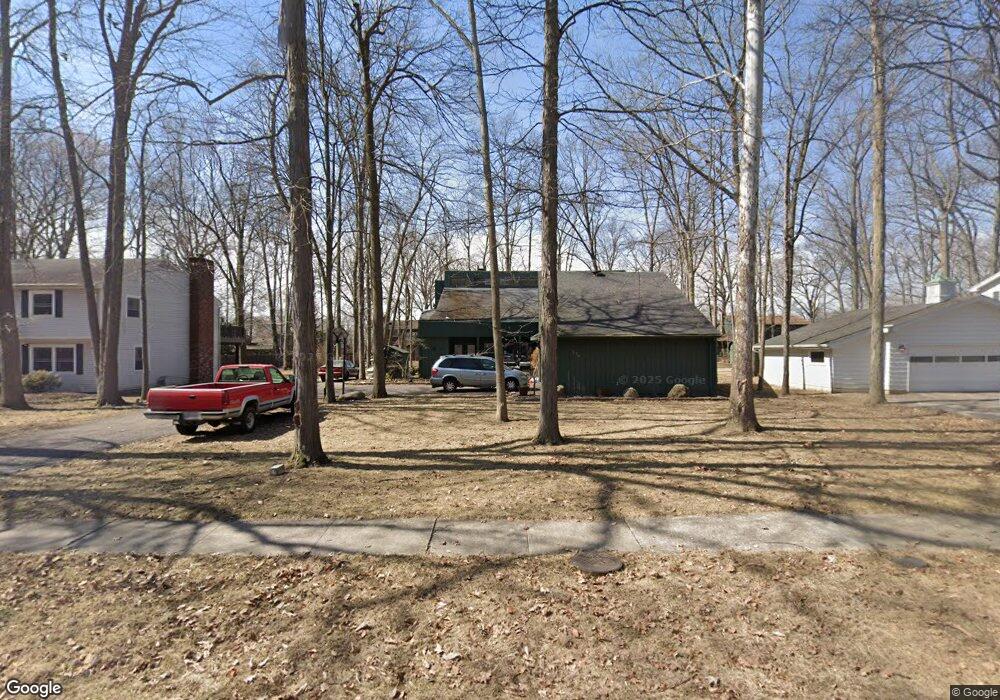
536 Sutton Place Findlay, OH 45840
Estimated Value: $305,000 - $329,000
4
Beds
3
Baths
2,771
Sq Ft
$115/Sq Ft
Est. Value
About This Home
This home is located at 536 Sutton Place, Findlay, OH 45840 and is currently estimated at $317,575, approximately $114 per square foot. 536 Sutton Place is a home located in Hancock County with nearby schools including Wilson Vance Elementary School, Whittier Elementary School, and Donnell Middle School.
Ownership History
Date
Name
Owned For
Owner Type
Purchase Details
Closed on
Jun 25, 2010
Sold by
Fannie Mae
Bought by
Bishop Brian L and Bishop Kathy E
Current Estimated Value
Home Financials for this Owner
Home Financials are based on the most recent Mortgage that was taken out on this home.
Original Mortgage
$115,425
Outstanding Balance
$76,041
Interest Rate
4.86%
Mortgage Type
New Conventional
Estimated Equity
$241,534
Purchase Details
Closed on
Oct 29, 2009
Sold by
Dudash James A and Dudash Stella M
Bought by
Federal National Mortgage Association
Purchase Details
Closed on
Jun 7, 1993
Bought by
Stevens Scott and Stevens Julie
Purchase Details
Closed on
Jun 19, 1986
Bought by
Moore Christopher A
Purchase Details
Closed on
Sep 12, 1984
Bought by
Brondes Julian R
Create a Home Valuation Report for This Property
The Home Valuation Report is an in-depth analysis detailing your home's value as well as a comparison with similar homes in the area
Home Values in the Area
Average Home Value in this Area
Purchase History
| Date | Buyer | Sale Price | Title Company |
|---|---|---|---|
| Bishop Brian L | $121,500 | Nova Title | |
| Federal National Mortgage Association | $90,000 | Attorney | |
| Stevens Scott | $135,000 | -- | |
| Moore Christopher A | $130,000 | -- | |
| Brondes Julian R | -- | -- |
Source: Public Records
Mortgage History
| Date | Status | Borrower | Loan Amount |
|---|---|---|---|
| Open | Bishop Brian L | $115,425 |
Source: Public Records
Tax History
| Year | Tax Paid | Tax Assessment Tax Assessment Total Assessment is a certain percentage of the fair market value that is determined by local assessors to be the total taxable value of land and additions on the property. | Land | Improvement |
|---|---|---|---|---|
| 2024 | $2,877 | $80,990 | $11,870 | $69,120 |
| 2023 | $2,882 | $80,990 | $11,870 | $69,120 |
| 2022 | $2,871 | $80,990 | $11,870 | $69,120 |
| 2021 | $2,622 | $64,410 | $11,870 | $52,540 |
| 2020 | $2,621 | $64,410 | $11,870 | $52,540 |
| 2019 | $2,568 | $64,410 | $11,870 | $52,540 |
| 2018 | $2,426 | $55,810 | $11,870 | $43,940 |
| 2017 | $1,213 | $55,810 | $11,870 | $43,940 |
| 2016 | $2,390 | $55,810 | $11,870 | $43,940 |
| 2015 | $2,479 | $56,690 | $12,600 | $44,090 |
| 2014 | $2,479 | $56,690 | $12,600 | $44,090 |
| 2012 | $2,496 | $56,690 | $12,600 | $44,090 |
Source: Public Records
Map
Nearby Homes
- 1825 Greendale Ave
- 2000 Rush Creek Ct
- 631 Winterhaven Dr
- 1926 Queenswood Dr
- 1828 Queenswood Dr
- 1724 Queenswood Dr Unit 10 (2-C)
- 801 Fox Run Rd
- 1521 Middle Ct
- 821 Fox Run Rd Unit 6
- 2245 Fox Run Cir Unit 1037
- 845 Fox Run Rd
- 1203 Chateau Ct
- 1121 Fox Run Rd
- 1308 Greendale Ave
- 0 Bright Rd Unit 6117142
- 0 Bright Rd Unit 6117138
- 0 Bright Rd Unit 6117143
- 0 Bright Rd Unit 6117148
- 1450 Fostoria Ave
- 100 Warrington Ave
- 600 Sutton Place
- 532 Sutton Place
- 601 Bristol Dr
- 606 Sutton Place
- 528 Sutton Place
- 533 Bristol Dr
- 605 Bristol Dr
- 537 Sutton Place
- 601 Sutton Place
- 533 Sutton Place
- 529 Bristol Dr
- 605 Sutton Place
- 609 Bristol Dr
- 612 Sutton Place
- 529 Sutton Place
- 1900 Imperial Ln
- 609 Sutton Place
- 615 Bristol Dr
- 536 Yorkshire Dr
- 615 Sutton Place
Your Personal Tour Guide
Ask me questions while you tour the home.