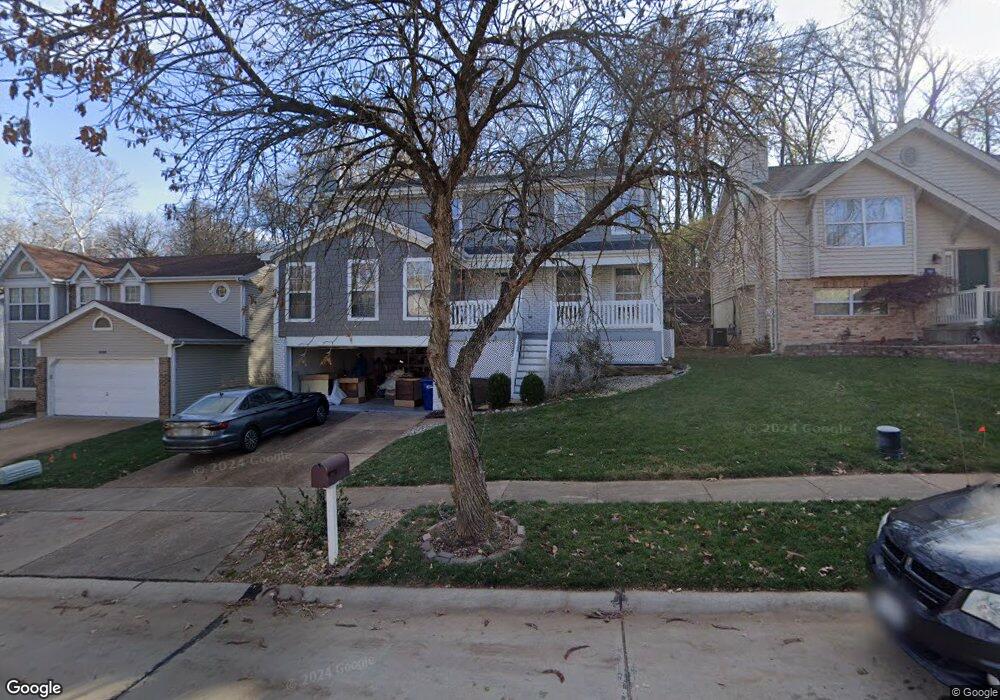
536 Woodlyn Crossing Ballwin, MO 63021
Estimated Value: $364,000 - $442,000
4
Beds
3
Baths
2,284
Sq Ft
$171/Sq Ft
Est. Value
About This Home
This home is located at 536 Woodlyn Crossing, Ballwin, MO 63021 and is currently estimated at $390,428, approximately $170 per square foot. 536 Woodlyn Crossing is a home located in St. Louis County with nearby schools including Oak Brook Elementary School, Parkway Southwest Middle School, and Parkway South High School.
Ownership History
Date
Name
Owned For
Owner Type
Purchase Details
Closed on
Dec 17, 2024
Sold by
Beard Charles R and Beard Joy M
Bought by
Beard Family Revocable Living Trust and Beard
Current Estimated Value
Purchase Details
Closed on
Apr 14, 2022
Sold by
Beard Jr Charles R and Beard Joy M
Bought by
Beard Charles R and Beard Joy M
Purchase Details
Closed on
Aug 30, 2013
Sold by
Beard Paula D and Beard Charles R
Bought by
Beard Charles R and Beard Paula D
Purchase Details
Closed on
Feb 25, 1999
Sold by
Dierker Kenneth N
Bought by
Cramer Paula D
Home Financials for this Owner
Home Financials are based on the most recent Mortgage that was taken out on this home.
Original Mortgage
$143,000
Interest Rate
9.62%
Purchase Details
Closed on
Dec 22, 1998
Sold by
First Federal Lincoln Bank
Bought by
Dierker Kenneth N
Purchase Details
Closed on
Nov 18, 1998
Sold by
Lii Sanders Danny and Lii Michelle R
Bought by
First Fsl Of Lincoln
Create a Home Valuation Report for This Property
The Home Valuation Report is an in-depth analysis detailing your home's value as well as a comparison with similar homes in the area
Home Values in the Area
Average Home Value in this Area
Purchase History
| Date | Buyer | Sale Price | Title Company |
|---|---|---|---|
| Beard Family Revocable Living Trust | -- | None Listed On Document | |
| Beard Family Revocable Living Trust | -- | None Listed On Document | |
| Beard Charles R | -- | None Listed On Document | |
| Beard Charles R | -- | Title Partners Agency Llc | |
| Cramer Paula D | $159,000 | -- | |
| Dierker Kenneth N | $115,500 | -- | |
| First Fsl Of Lincoln | $102,000 | First American Title |
Source: Public Records
Mortgage History
| Date | Status | Borrower | Loan Amount |
|---|---|---|---|
| Previous Owner | Cramer Paula D | $143,000 |
Source: Public Records
Tax History Compared to Growth
Tax History
| Year | Tax Paid | Tax Assessment Tax Assessment Total Assessment is a certain percentage of the fair market value that is determined by local assessors to be the total taxable value of land and additions on the property. | Land | Improvement |
|---|---|---|---|---|
| 2025 | $3,908 | $68,510 | $27,150 | $41,360 |
| 2024 | $3,908 | $60,120 | $17,460 | $42,660 |
| 2023 | $3,944 | $60,120 | $17,460 | $42,660 |
| 2022 | $3,791 | $52,950 | $19,400 | $33,550 |
| 2021 | $3,768 | $52,950 | $19,400 | $33,550 |
| 2020 | $3,793 | $50,950 | $17,210 | $33,740 |
| 2019 | $3,748 | $50,950 | $17,210 | $33,740 |
| 2018 | $3,379 | $42,470 | $13,400 | $29,070 |
| 2017 | $3,341 | $42,470 | $13,400 | $29,070 |
| 2016 | $3,238 | $39,030 | $9,600 | $29,430 |
| 2015 | $3,385 | $39,030 | $9,600 | $29,430 |
| 2014 | $2,668 | $34,240 | $9,560 | $24,680 |
Source: Public Records
Map
Nearby Homes
- 505 Treetop Village Dr
- 524 Elm Crossing Ct
- 1316 Red Oak Plantation Dr
- 637 Brook Meadow Dr
- 586 Brook Meadow Dr
- 640 Painted Vista Dr
- 1233 Red Oak Plantation Dr
- 700 Ridgeside Dr Unit L
- 1389 Red Oak Plantation Dr
- 1231 Bedford Falls Ct
- 1222 Meramec Heights Dr Unit 40
- 746 Windy Ridge Dr
- 334 Lauren Landing
- 521 Spring Glen Dr
- 530 Spring Glen Dr
- 531 Spring Glen Dr Unit 71R
- 1020 Treetop Village Dr Unit 76R
- 442 Oak Glen Dr
- 1626 Forest Springs Ln Unit C
- 1111 Shadowoak Dr
- 540 Woodlyn Crossing
- 532 Woodlyn Crossing
- 544 Woodlyn Crossing
- 528 Woodlyn Crossing
- 541 Woodlyn Crossing
- 537 Woodlyn Crossing
- 548 Woodlyn Crossing
- 524 Woodlyn Crossing
- 533 Woodlyn Crossing
- 545 Woodlyn Crossing
- 1540 Greenfield Crossing Ct
- 1544 Greenfield Crossing Ct
- 529 Woodlyn Crossing
- 549 Woodlyn Crossing
- 1536 Greenfield Crossing Ct
- 552 Woodlyn Crossing
- 520 Woodlyn Crossing
- 1548 Greenfield Crossing Ct
- 1532 Greenfield Crossing Ct
- 1552 Greenfield Crossing Ct