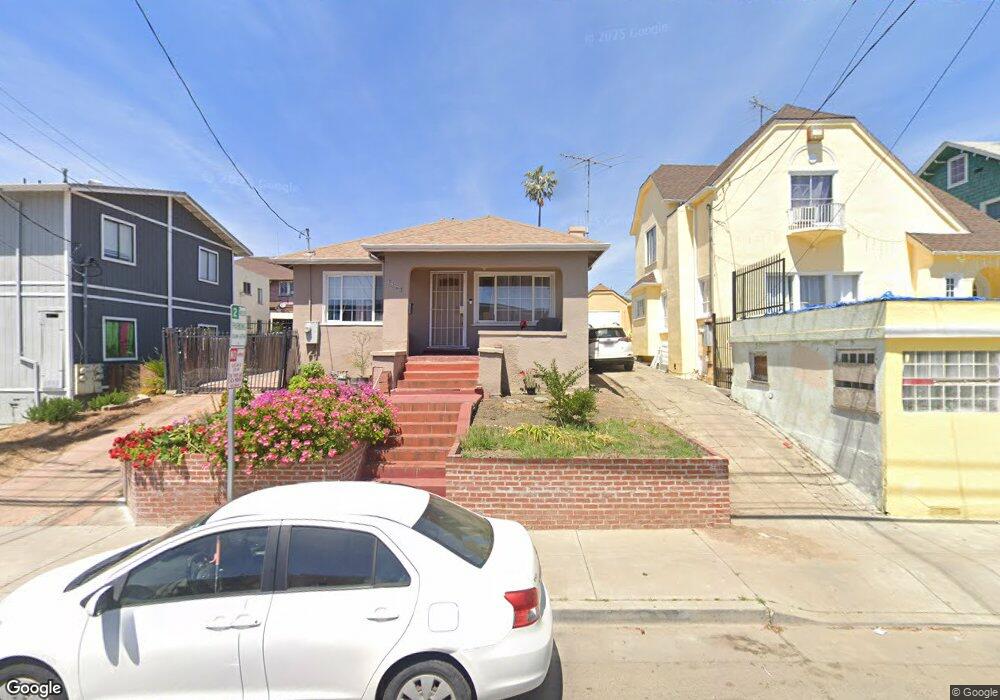
5362 Foothill Blvd Oakland, CA 94601
Melrose Heights NeighborhoodEstimated Value: $399,000 - $498,000
2
Beds
1
Bath
1,248
Sq Ft
$374/Sq Ft
Est. Value
About This Home
This home is located at 5362 Foothill Blvd, Oakland, CA 94601 and is currently estimated at $466,838, approximately $374 per square foot. 5362 Foothill Blvd is a home located in Alameda County with nearby schools including Horace Mann Elementary School, Frick United Academy of Language, and Fremont High School.
Ownership History
Date
Name
Owned For
Owner Type
Purchase Details
Closed on
Feb 13, 2014
Sold by
Tang Grace M and Suh Philip J
Bought by
Suh Philip J and Suh Hannah J
Current Estimated Value
Purchase Details
Closed on
Aug 11, 2009
Sold by
Suh Hannah
Bought by
Suh Phillip J
Purchase Details
Closed on
Jul 6, 2009
Sold by
Greenpoint Mortgage Funding Inc
Bought by
Suh Grace M and Suh Philip J
Purchase Details
Closed on
Aug 23, 2008
Sold by
Murillo Juan and Diaz Alicia E
Bought by
Greenpoint Mortgage Funding Inc
Purchase Details
Closed on
Mar 3, 1998
Sold by
Lincoln Trust Company and G N
Bought by
Murillo Juan and Diaz Alicia E
Home Financials for this Owner
Home Financials are based on the most recent Mortgage that was taken out on this home.
Original Mortgage
$68,400
Interest Rate
7.02%
Create a Home Valuation Report for This Property
The Home Valuation Report is an in-depth analysis detailing your home's value as well as a comparison with similar homes in the area
Home Values in the Area
Average Home Value in this Area
Purchase History
| Date | Buyer | Sale Price | Title Company |
|---|---|---|---|
| Suh Philip J | -- | None Available | |
| Suh Phillip J | -- | Old Republic Title Company F | |
| Suh Grace M | $110,000 | Old Republic Title Company F | |
| Greenpoint Mortgage Funding Inc | $300,000 | None Available | |
| Murillo Juan | $72,000 | Fidelity National Title Co |
Source: Public Records
Mortgage History
| Date | Status | Borrower | Loan Amount |
|---|---|---|---|
| Previous Owner | Murillo Juan | $68,400 |
Source: Public Records
Tax History
| Year | Tax Paid | Tax Assessment Tax Assessment Total Assessment is a certain percentage of the fair market value that is determined by local assessors to be the total taxable value of land and additions on the property. | Land | Improvement |
|---|---|---|---|---|
| 2025 | $3,603 | $141,980 | $42,594 | $99,386 |
| 2024 | $3,603 | $139,197 | $41,759 | $97,438 |
| 2023 | $3,670 | $136,467 | $40,940 | $95,527 |
| 2022 | $3,510 | $133,792 | $40,137 | $93,655 |
| 2021 | $3,218 | $131,170 | $39,351 | $91,819 |
| 2020 | $3,181 | $129,825 | $38,947 | $90,878 |
| 2019 | $2,975 | $127,280 | $38,184 | $89,096 |
| 2018 | $2,917 | $124,785 | $37,435 | $87,350 |
| 2017 | $2,774 | $122,338 | $36,701 | $85,637 |
| 2016 | $2,600 | $119,941 | $35,982 | $83,959 |
| 2015 | $2,583 | $118,140 | $35,442 | $82,698 |
| 2014 | $2,511 | $115,827 | $34,748 | $81,079 |
Source: Public Records
Map
Nearby Homes
- 5406 Trask St
- 5428 Ruth Ave
- 5400 Princeton St
- 5503 Foothill Blvd
- 5492 Ruth Ave
- 1826 Vicksburg Ave Unit 1
- 2622 Kingsland Ave
- 5500 Laverne Ave
- 5339 Princeton St
- 5609 Foothill Blvd
- 2569 Maxwell Ave
- 2100 51st Ave
- 5440 Wadean Place
- 5116 Bancroft Ave
- 2645 Maxwell Ave
- 2600 55th Ave
- 5706 Brookdale Ave
- 1909 51st Ave
- 2469 Potter St
- 2015 50th Ave
- 5380 Foothill Blvd
- 5324 Belvedere St
- 5338 Belvedere St Unit D
- 5338 Belvedere St Unit C
- 5338 Belvedere St
- 5394 Foothill Blvd
- 5320 Belvedere St
- 5321 Cole St
- 5335 Cole St
- 5314 Belvedere St
- 5315 Cole St
- 5353 Ygnacio Ave
- 5305 Cole St
- 5353 Foothill Blvd
- 5320 Cole St
- 5400 Foothill Blvd
- 5313 Belvedere St
- 5311 Belvedere St
- 5415 Cole St
- 5404 Foothill Blvd
Your Personal Tour Guide
Ask me questions while you tour the home.