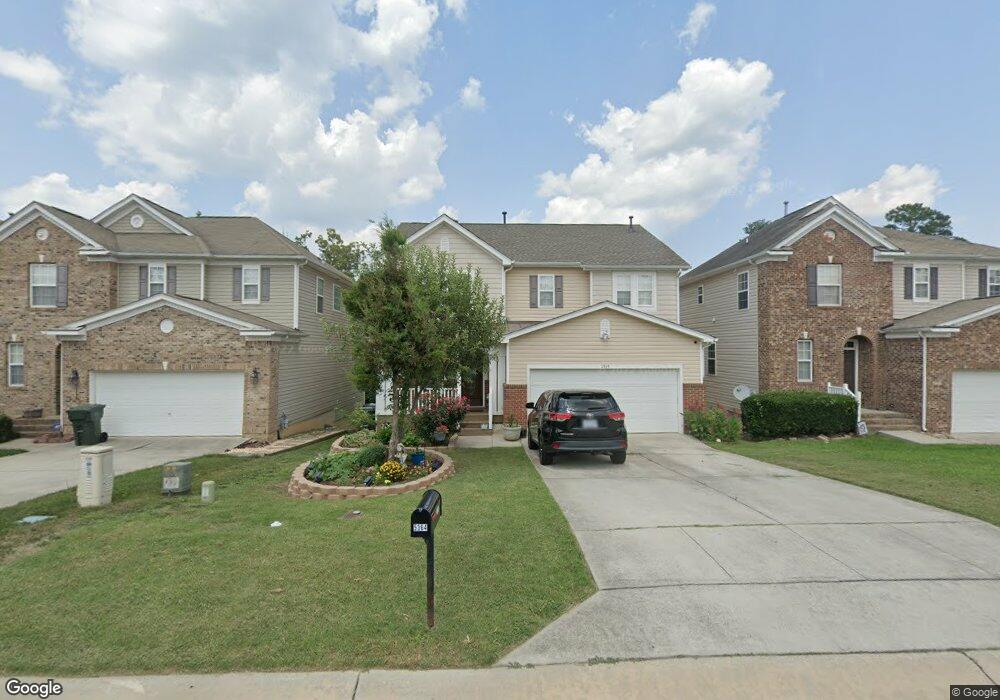
5364 Meryton Park Way Raleigh, NC 27616
Forestville NeighborhoodEstimated Value: $387,000 - $394,082
5
Beds
4
Baths
2,170
Sq Ft
$180/Sq Ft
Est. Value
About This Home
This home is located at 5364 Meryton Park Way, Raleigh, NC 27616 and is currently estimated at $390,771, approximately $180 per square foot. 5364 Meryton Park Way is a home located in Wake County with nearby schools including Wildwood Forest Elementary, East Millbrook Middle, and Wakefield High School.
Ownership History
Date
Name
Owned For
Owner Type
Purchase Details
Closed on
May 10, 2019
Sold by
Merino Janeth C
Bought by
Delcid Jose Marcedonio and Vidal Gazca Eloisa
Current Estimated Value
Home Financials for this Owner
Home Financials are based on the most recent Mortgage that was taken out on this home.
Original Mortgage
$166,920
Outstanding Balance
$149,355
Interest Rate
5.12%
Mortgage Type
FHA
Estimated Equity
$241,416
Purchase Details
Closed on
Jun 12, 2018
Sold by
Merino Carlos J and Merino Alcira
Bought by
Merino Janet C
Purchase Details
Closed on
Oct 27, 2005
Sold by
Kb Home Raleigh Durham Llc
Bought by
Merino Carlos J and Merino Alcira
Home Financials for this Owner
Home Financials are based on the most recent Mortgage that was taken out on this home.
Original Mortgage
$162,300
Interest Rate
7.29%
Mortgage Type
Fannie Mae Freddie Mac
Purchase Details
Closed on
Mar 28, 2005
Sold by
Thorton Ventures Llc
Bought by
Kb Home Raleigh Durham Llc
Create a Home Valuation Report for This Property
The Home Valuation Report is an in-depth analysis detailing your home's value as well as a comparison with similar homes in the area
Home Values in the Area
Average Home Value in this Area
Purchase History
| Date | Buyer | Sale Price | Title Company |
|---|---|---|---|
| Delcid Jose Marcedonio | $170,000 | None Available | |
| Delcid Jose Marcedonio | $170,000 | None Listed On Document | |
| Merino Janet C | -- | None Available | |
| Merino Carlos J | $203,000 | None Available | |
| Kb Home Raleigh Durham Llc | $429,000 | -- |
Source: Public Records
Mortgage History
| Date | Status | Borrower | Loan Amount |
|---|---|---|---|
| Open | Delcid Jose Marcedonio | $166,920 | |
| Closed | Delcid Jose Marcedonio | $166,920 | |
| Previous Owner | Merino Carlos J | $162,300 |
Source: Public Records
Tax History Compared to Growth
Tax History
| Year | Tax Paid | Tax Assessment Tax Assessment Total Assessment is a certain percentage of the fair market value that is determined by local assessors to be the total taxable value of land and additions on the property. | Land | Improvement |
|---|---|---|---|---|
| 2025 | $3,596 | $410,066 | $80,000 | $330,066 |
| 2024 | $3,581 | $410,066 | $80,000 | $330,066 |
| 2023 | $2,616 | $238,137 | $42,000 | $196,137 |
| 2022 | $2,431 | $238,137 | $42,000 | $196,137 |
| 2021 | $2,337 | $238,137 | $42,000 | $196,137 |
| 2020 | $2,295 | $238,137 | $42,000 | $196,137 |
| 2019 | $2,377 | $203,347 | $30,000 | $173,347 |
| 2018 | $2,242 | $203,347 | $30,000 | $173,347 |
| 2017 | $2,135 | $203,347 | $30,000 | $173,347 |
| 2016 | $2,092 | $203,347 | $30,000 | $173,347 |
| 2015 | $2,285 | $218,728 | $36,000 | $182,728 |
| 2014 | $2,167 | $218,728 | $36,000 | $182,728 |
Source: Public Records
Map
Nearby Homes
- 8911 Elizabeth Benneth Place
- 5126 Thornton Knoll Way
- 8857 Thornton Town Place
- 8947 Commons Townes Dr
- 8957 Commons Townes Dr
- 5163 Sandy Banks Rd
- 8885 Commons Townes Dr
- 5107 Sandy Banks Rd
- SYDNEY Plan at Thornton Townes
- JONATHAN Plan at Thornton Townes
- 5121 Neuse Commons Ln
- 8707 River Keeper Way
- 8640 Neuse Landing Ln Unit 110
- 8610 Neuse Landing Ln Unit 103
- 8620 Neuse Club Ln Unit 111
- 8620 Neuse Club Ln Unit 107
- 8702 Neuse Town Dr
- 5309 Neuse Wood Dr
- 8537 Beckett Chase Way
- 8535 Beckett Chase Way
- 5364 Meryton Pkwy
- 5368 Meryton Pkwy
- 5368 Meryton Park Way
- 5360 Meryton Park Way
- 5360 Meryton Pkwy
- 5372 Meryton Pkwy
- 5356 Meryton Pkwy
- 5372 Meryton Park Way
- 5356 Meryton Park Way
- 5376 Meryton Pkwy
- 5376 Meryton Park Way
- 5352 Meryton Pkwy
- 5365 Meryton Pkwy
- 5369 Meryton Pkwy
- 5365 Meryton Park Way
- 5361 Meryton Pkwy
- 5380 Meryton Pkwy
- 5380 Meryton Park Way
- 5373 Meryton Pkwy
- 5357 Meryton Park Way