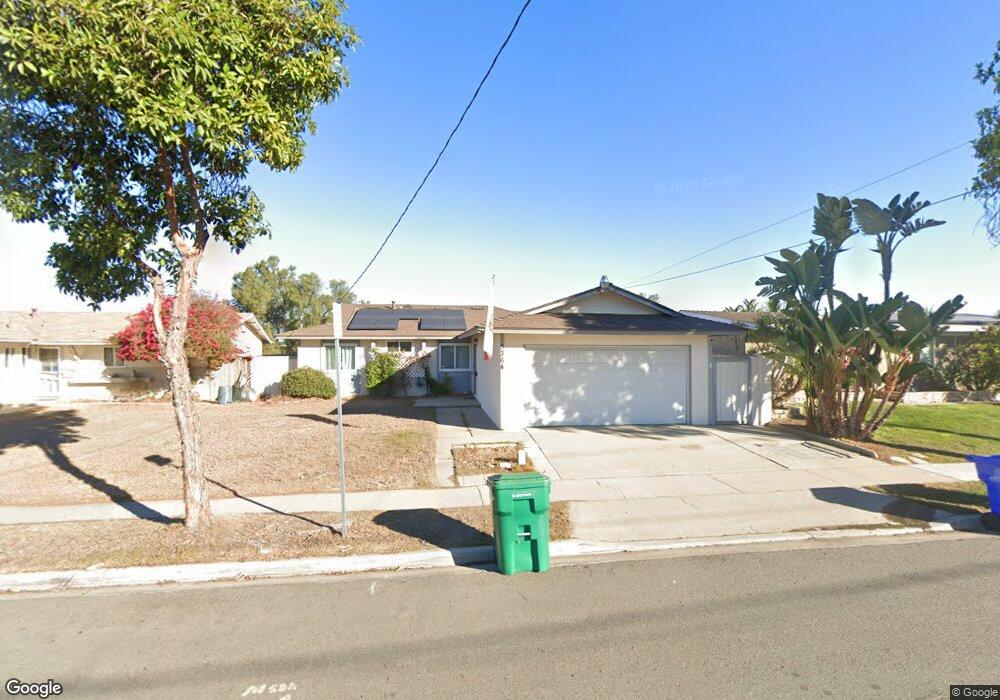
5364 Peyton Place San Diego, CA 92117
North Clairemont NeighborhoodEstimated Value: $998,000 - $1,154,000
4
Beds
2
Baths
1,397
Sq Ft
$782/Sq Ft
Est. Value
About This Home
This home is located at 5364 Peyton Place, San Diego, CA 92117 and is currently estimated at $1,092,983, approximately $782 per square foot. 5364 Peyton Place is a home located in San Diego County with nearby schools including Hawthorne Elementary School, Innovation Middle School, and Madison High School.
Ownership History
Date
Name
Owned For
Owner Type
Purchase Details
Closed on
Jun 30, 2022
Sold by
Daeho Beste Nathan and Frederick Michael
Bought by
Beste Nathan Daeho and Ballard Michael Frederick
Current Estimated Value
Purchase Details
Closed on
Aug 30, 2021
Sold by
Beste Jeremy and Beste Moosong L
Bought by
Beste Jeremy C
Purchase Details
Closed on
Aug 30, 2005
Sold by
Beste Jeremy C and Beste Moosong L
Bought by
Beste Jeremy and Beste Moosong L
Home Financials for this Owner
Home Financials are based on the most recent Mortgage that was taken out on this home.
Original Mortgage
$348,000
Interest Rate
5.76%
Mortgage Type
New Conventional
Purchase Details
Closed on
Mar 23, 2004
Sold by
Beste Jeremy C and Beste Moosong L
Bought by
Beste Jeremy and Beste Moosong L
Purchase Details
Closed on
Apr 30, 1986
Purchase Details
Closed on
Apr 12, 1985
Purchase Details
Closed on
Aug 5, 1983
Create a Home Valuation Report for This Property
The Home Valuation Report is an in-depth analysis detailing your home's value as well as a comparison with similar homes in the area
Home Values in the Area
Average Home Value in this Area
Purchase History
| Date | Buyer | Sale Price | Title Company |
|---|---|---|---|
| Beste Nathan Daeho | -- | Fidelity National Title | |
| Beste Jeremy C | -- | Accommodation | |
| Beste Jeremy | -- | Fidelity National Title | |
| Beste Jeremy C | -- | Fidelity National Title | |
| Beste Jeremy | -- | -- | |
| -- | $113,000 | -- | |
| -- | $103,000 | -- | |
| -- | $59,200 | -- |
Source: Public Records
Mortgage History
| Date | Status | Borrower | Loan Amount |
|---|---|---|---|
| Previous Owner | Beste Jeremy C | $348,000 |
Source: Public Records
Tax History Compared to Growth
Tax History
| Year | Tax Paid | Tax Assessment Tax Assessment Total Assessment is a certain percentage of the fair market value that is determined by local assessors to be the total taxable value of land and additions on the property. | Land | Improvement |
|---|---|---|---|---|
| 2025 | $10,937 | $912,638 | $764,069 | $148,569 |
| 2024 | $10,937 | $894,744 | $749,088 | $145,656 |
| 2023 | $10,239 | $840,000 | $703,000 | $137,000 |
| 2022 | $2,612 | $212,007 | $63,944 | $148,063 |
| 2021 | $2,594 | $207,851 | $62,691 | $145,160 |
| 2020 | $2,563 | $205,721 | $62,049 | $143,672 |
| 2019 | $2,518 | $201,688 | $60,833 | $140,855 |
| 2018 | $2,355 | $197,735 | $59,641 | $138,094 |
| 2017 | $2,299 | $193,859 | $58,472 | $135,387 |
| 2016 | $2,261 | $190,059 | $57,326 | $132,733 |
| 2015 | $2,228 | $187,205 | $56,465 | $130,740 |
| 2014 | $2,194 | $183,538 | $55,359 | $128,179 |
Source: Public Records
Map
Nearby Homes
- 5284 Winthrop St
- 5162 Limerick Ave
- 5302 Lehrer Dr
- 5165 Winthrop St
- 5170 Clairemont Mesa Blvd Unit 27
- 5170 Clairemont Mesa Blvd Unit 8
- 6460 Convoy Ct Unit SPC 59
- 6460 Convoy Ct Unit 185
- 6460 Convoy Ct Unit SPC 318
- 4843 Lehrer Dr
- 4827 Rushden Ave
- 5124 Acuna St
- 5266 Diane Ave
- 4979 Acuna St
- 5021 Via Cinta
- 5448 Noah Way
- 4716 Mount Cervin Dr
- 5656 Chandler Dr
- 5113 Bellvale Ave
- 5715 Castleton Dr
- 5354 Peyton Place
- 5406 Peyton Place
- 5344 Peyton Place
- 5416 Peyton Place
- 5353 Sunglow Ct
- 5363 Sunglow Ct
- 5343 Sunglow Ct
- 5334 Peyton Place
- 5186 Arvinels Ave
- 5373 Sunglow Ct
- 5393 Peyton Place
- 5426 Peyton Place
- 5333 Sunglow Ct
- 5379 Peyton Place
- 5324 Peyton Place
- 5367 Peyton Place
- 5383 Sunglow Ct
- 5178 Arvinels Ave
- 5197 Arvinels Ave
- 5355 Peyton Place