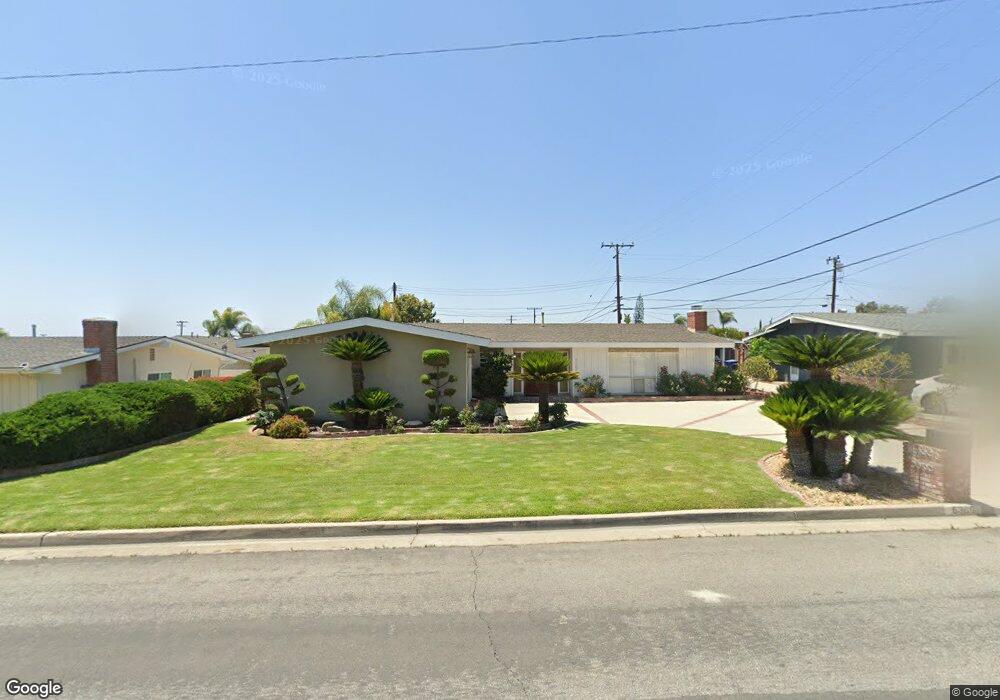
5365 Kenwood Ave Buena Park, CA 90621
Estimated Value: $1,114,000 - $1,306,000
3
Beds
3
Baths
2,304
Sq Ft
$536/Sq Ft
Est. Value
About This Home
This home is located at 5365 Kenwood Ave, Buena Park, CA 90621 and is currently estimated at $1,235,555, approximately $536 per square foot. 5365 Kenwood Ave is a home located in Orange County with nearby schools including Charles G. Emery Elementary School, Buena Park Junior High School, and Sunny Hills High School.
Ownership History
Date
Name
Owned For
Owner Type
Purchase Details
Closed on
Dec 27, 2022
Sold by
Donna M Berry Family Trust
Bought by
Detlefsen Michael Alan and Detlefsen Cynthia Lynn
Current Estimated Value
Home Financials for this Owner
Home Financials are based on the most recent Mortgage that was taken out on this home.
Original Mortgage
$550,000
Outstanding Balance
$532,647
Interest Rate
6.49%
Mortgage Type
New Conventional
Estimated Equity
$702,908
Purchase Details
Closed on
Mar 2, 2006
Sold by
Berry Donna Mae
Bought by
Berry Donna M and The Donna M Berry Family
Home Financials for this Owner
Home Financials are based on the most recent Mortgage that was taken out on this home.
Original Mortgage
$100,000
Interest Rate
6.04%
Mortgage Type
Credit Line Revolving
Purchase Details
Closed on
Jul 10, 2000
Sold by
Mae Berry Donna
Bought by
Berry Donna M and The Donna M Berry Family Trust
Create a Home Valuation Report for This Property
The Home Valuation Report is an in-depth analysis detailing your home's value as well as a comparison with similar homes in the area
Home Values in the Area
Average Home Value in this Area
Purchase History
| Date | Buyer | Sale Price | Title Company |
|---|---|---|---|
| Detlefsen Michael Alan | $775,000 | Pacific Coast Title | |
| Berry Donna M | -- | Accommodation | |
| Berry Donna M | -- | First American Title Ins Co | |
| Berry Donna M | -- | -- |
Source: Public Records
Mortgage History
| Date | Status | Borrower | Loan Amount |
|---|---|---|---|
| Open | Detlefsen Michael Alan | $550,000 | |
| Previous Owner | Berry Donna M | $100,000 |
Source: Public Records
Tax History Compared to Growth
Tax History
| Year | Tax Paid | Tax Assessment Tax Assessment Total Assessment is a certain percentage of the fair market value that is determined by local assessors to be the total taxable value of land and additions on the property. | Land | Improvement |
|---|---|---|---|---|
| 2025 | $11,416 | $1,040,400 | $832,320 | $208,080 |
| 2024 | $11,416 | $1,020,000 | $816,000 | $204,000 |
| 2023 | $9,246 | $820,233 | $652,684 | $167,549 |
| 2022 | $1,966 | $154,193 | $51,902 | $102,291 |
| 2021 | $1,949 | $151,170 | $50,884 | $100,286 |
| 2020 | $1,925 | $149,620 | $50,362 | $99,258 |
| 2019 | $1,883 | $146,687 | $49,375 | $97,312 |
| 2018 | $1,847 | $143,811 | $48,407 | $95,404 |
| 2017 | $1,820 | $140,992 | $47,458 | $93,534 |
| 2016 | $1,784 | $138,228 | $46,528 | $91,700 |
| 2015 | $1,712 | $136,152 | $45,829 | $90,323 |
| 2014 | $1,701 | $133,485 | $44,931 | $88,554 |
Source: Public Records
Map
Nearby Homes
- 5211 Fox Hills Ave
- 8542 Emerywood Dr
- 5412 Arrowhead Ave
- 8237 Henshaw Cir
- 8244 Henderson Green
- 9 Coveside Ct
- 4900 Lincolnshire Ave
- 5471 Jonesboro Way
- 65 Windward Way Unit 23
- 5588 Cajon Ave
- 86 Lakeside Dr
- 6 Tidewater Cove
- 11 Travis Rd
- 4738 Durango Dr
- 5941 Stanton Ave
- 2523 Cypress Point Dr
- 2150 Cheyenne Way Unit 169
- 5822 Fullerton Ave
- 14806 Faceta Dr
- 4014 W Commonwealth Ave
- 5381 Kenwood Ave
- 8471 Deepdale Ave
- 5360 Burlingame Ave
- 5335 Kenwood Ave
- 5350 Burlingame Ave
- 5380 Burlingame Ave
- 5352 Kenwood Ave
- 5340 Burlingame Ave
- 5340 Kenwood Ave
- 5315 Kenwood Ave
- 8521 Deepdale Ave
- 5322 Kenwood Ave
- 8492 Deepdale Ave
- 8472 Deepdale Ave
- 5320 Burlingame Ave
- 5410 Burlingame Ave
- 5365 Burlingame Ave
- 5285 Kenwood Ave
- 5310 Kenwood Ave
- 5345 Burlingame Ave