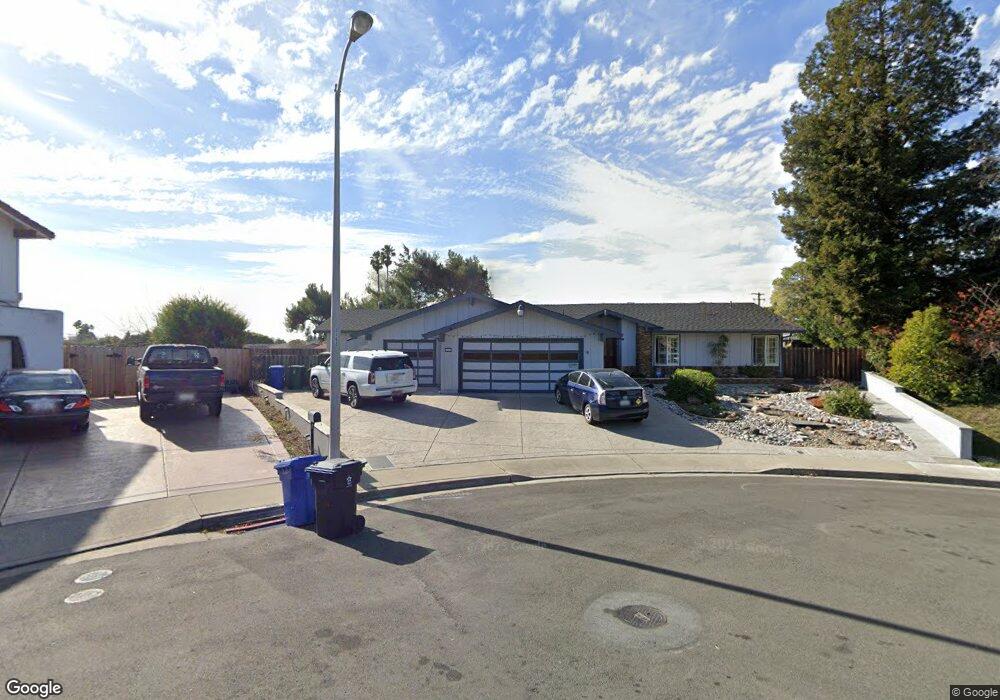
5369 Ashbourne Ct Newark, CA 94560
Estimated Value: $1,588,000 - $1,967,000
3
Beds
2
Baths
2,366
Sq Ft
$742/Sq Ft
Est. Value
About This Home
This home is located at 5369 Ashbourne Ct, Newark, CA 94560 and is currently estimated at $1,754,440, approximately $741 per square foot. 5369 Ashbourne Ct is a home located in Alameda County with nearby schools including John F. Kennedy Elementary School, Newark Junior High School, and Newark Memorial High School.
Ownership History
Date
Name
Owned For
Owner Type
Purchase Details
Closed on
Oct 7, 2015
Sold by
Pereira Michael and Pereira Christine J
Bought by
Ge Ning and Shi Jun
Current Estimated Value
Home Financials for this Owner
Home Financials are based on the most recent Mortgage that was taken out on this home.
Original Mortgage
$712,000
Outstanding Balance
$542,906
Interest Rate
3%
Mortgage Type
Adjustable Rate Mortgage/ARM
Estimated Equity
$1,211,534
Purchase Details
Closed on
Mar 19, 2002
Sold by
Pereira Michael and Pereira Christine J
Bought by
Pereira Michael and Pereira Christine J
Home Financials for this Owner
Home Financials are based on the most recent Mortgage that was taken out on this home.
Original Mortgage
$275,000
Interest Rate
6.84%
Purchase Details
Closed on
May 27, 1998
Sold by
Fernandez Donald G and Fernandez Wyona E
Bought by
Pereira Michael and Fernandez Christine J
Home Financials for this Owner
Home Financials are based on the most recent Mortgage that was taken out on this home.
Original Mortgage
$280,000
Interest Rate
7.1%
Create a Home Valuation Report for This Property
The Home Valuation Report is an in-depth analysis detailing your home's value as well as a comparison with similar homes in the area
Home Values in the Area
Average Home Value in this Area
Purchase History
| Date | Buyer | Sale Price | Title Company |
|---|---|---|---|
| Ge Ning | $890,000 | Chicago Title Company | |
| Pereira Michael | -- | American Title Co | |
| Pereira Michael | $350,000 | American Title Co |
Source: Public Records
Mortgage History
| Date | Status | Borrower | Loan Amount |
|---|---|---|---|
| Open | Ge Ning | $712,000 | |
| Previous Owner | Pereira Michael | $275,000 | |
| Previous Owner | Pereira Michael | $280,000 |
Source: Public Records
Tax History
| Year | Tax Paid | Tax Assessment Tax Assessment Total Assessment is a certain percentage of the fair market value that is determined by local assessors to be the total taxable value of land and additions on the property. | Land | Improvement |
|---|---|---|---|---|
| 2025 | $12,697 | $1,053,554 | $316,066 | $737,488 |
| 2024 | $12,697 | $1,032,897 | $309,869 | $723,028 |
| 2023 | $12,367 | $1,012,650 | $303,795 | $708,855 |
| 2022 | $12,226 | $992,794 | $297,838 | $694,956 |
| 2021 | $11,918 | $973,330 | $291,999 | $681,331 |
| 2020 | $11,810 | $963,353 | $289,006 | $674,347 |
| 2019 | $11,639 | $944,467 | $283,340 | $661,127 |
| 2018 | $11,471 | $925,955 | $277,786 | $648,169 |
| 2017 | $11,182 | $907,800 | $272,340 | $635,460 |
| 2016 | $11,082 | $890,000 | $267,000 | $623,000 |
| 2015 | $4,579 | $345,008 | $103,095 | $241,913 |
| 2014 | $4,451 | $338,251 | $101,076 | $237,175 |
Source: Public Records
Map
Nearby Homes
- 35415 Blackburn Dr
- 5136 Ramsgate Dr
- 35290 Farnham Dr
- 35088 Lido Blvd Unit K
- 35442 Breton Dr
- 35926 Newark Blvd
- 5298 Sussex Place
- 34827 Dorado Common
- 5245 Tacoma Common
- 34743 Chanel Terrace
- 34590 Falls Terrace
- 34767 Shalimar Terrace
- 36188 Fig Tree Ln
- 34744 Tuxedo Common
- 5220 Fairbanks Common
- 5417 Ridgewood Dr
- 36057 Dalewood Dr
- 35345 Cabral Dr
- 5228 Falmouth Place
- 35795 Cabral Dr
- 5353 Ashbourne Ct
- 5372 Chapman Dr
- 5368 Ashbourne Ct
- 5388 Chapman Dr
- 5356 Chapman Dr
- 5352 Ashbourne Ct
- 5337 Ashbourne Ct
- 5394 Chapman Dr
- 5340 Chapman Dr
- 5336 Ashbourne Ct
- 5355 Castleford Ct
- 5371 Castleford Ct
- 35181 Donegal Ct
- 5321 Ashbourne Ct
- 5406 Chapman Dr
- 5324 Chapman Dr
- 35176 Cardiff St
- 5320 Ashbourne Ct
- 5339 Castleford Ct
- 35178 Donegal Ct
Your Personal Tour Guide
Ask me questions while you tour the home.