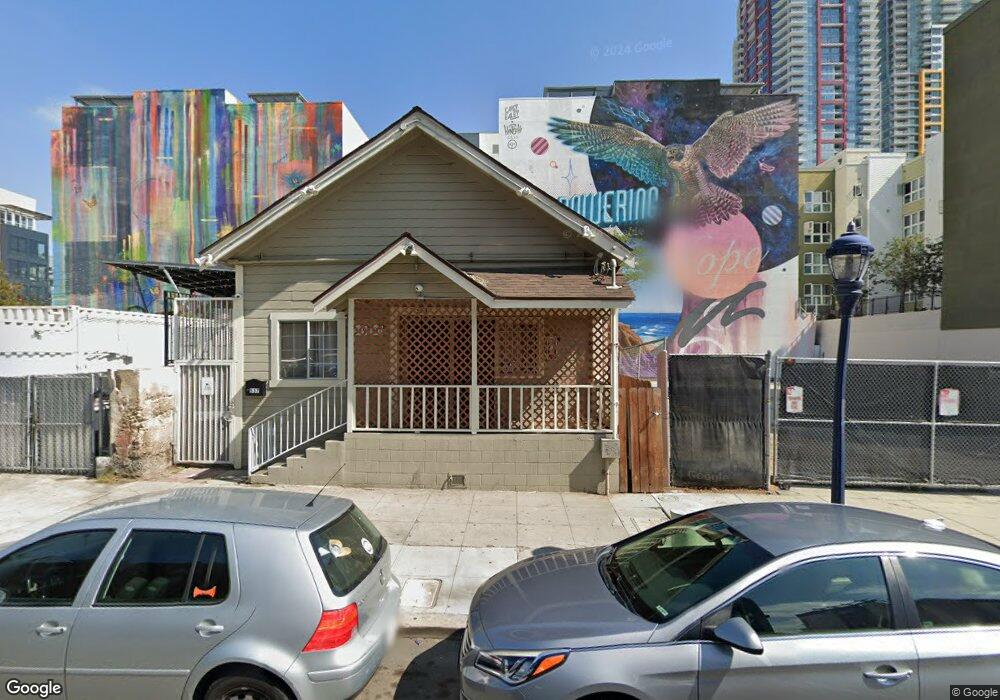
537 13th St Unit 39 San Diego, CA 92101
East Village NeighborhoodEstimated Value: $596,000 - $1,610,000
3
Beds
4
Baths
1,608
Sq Ft
$744/Sq Ft
Est. Value
About This Home
This home is located at 537 13th St Unit 39, San Diego, CA 92101 and is currently estimated at $1,196,476, approximately $744 per square foot. 537 13th St Unit 39 is a home located in San Diego County with nearby schools including Sherman Elementary School, Logan Memorial Educational Campus, and Urban Discovery Academy Charter.
Ownership History
Date
Name
Owned For
Owner Type
Purchase Details
Closed on
Nov 17, 2004
Sold by
Teran Mario J
Bought by
Tb Wraps Inc
Current Estimated Value
Purchase Details
Closed on
Jul 8, 2004
Sold by
Teran Mario J and Martija Ana Laura
Bought by
Teran Mario J
Home Financials for this Owner
Home Financials are based on the most recent Mortgage that was taken out on this home.
Original Mortgage
$487,500
Interest Rate
6%
Mortgage Type
Purchase Money Mortgage
Purchase Details
Closed on
Apr 22, 2004
Sold by
Tb Wraps Inc
Bought by
Teran Mario J
Purchase Details
Closed on
Feb 23, 2004
Sold by
Teran Mario J
Bought by
Tb Wraps Inc
Purchase Details
Closed on
Apr 18, 2002
Sold by
T B Wraps Inc
Bought by
Teran Mario J
Purchase Details
Closed on
Oct 25, 2001
Sold by
Arreola Lucinda
Bought by
Tb Wraps Inc
Home Financials for this Owner
Home Financials are based on the most recent Mortgage that was taken out on this home.
Original Mortgage
$130,000
Interest Rate
6.62%
Create a Home Valuation Report for This Property
The Home Valuation Report is an in-depth analysis detailing your home's value as well as a comparison with similar homes in the area
Home Values in the Area
Average Home Value in this Area
Purchase History
| Date | Buyer | Sale Price | Title Company |
|---|---|---|---|
| Tb Wraps Inc | -- | -- | |
| Teran Mario J | -- | Commonwealth Land Title Co | |
| Teran Mario J | -- | -- | |
| Tb Wraps Inc | -- | -- | |
| Teran Mario J | -- | -- | |
| Tb Wraps Inc | $90,000 | Benefit Land Title Company |
Source: Public Records
Mortgage History
| Date | Status | Borrower | Loan Amount |
|---|---|---|---|
| Previous Owner | Teran Mario J | $487,500 | |
| Previous Owner | Tb Wraps Inc | $130,000 |
Source: Public Records
Tax History Compared to Growth
Tax History
| Year | Tax Paid | Tax Assessment Tax Assessment Total Assessment is a certain percentage of the fair market value that is determined by local assessors to be the total taxable value of land and additions on the property. | Land | Improvement |
|---|---|---|---|---|
| 2025 | $2,793 | $162,478 | $155,103 | $7,375 |
| 2024 | $2,793 | $159,293 | $152,062 | $7,231 |
| 2023 | $2,710 | $156,171 | $149,081 | $7,090 |
| 2022 | $2,622 | $153,109 | $146,158 | $6,951 |
| 2021 | $2,575 | $150,108 | $143,293 | $6,815 |
| 2020 | $2,529 | $148,570 | $141,824 | $6,746 |
| 2019 | $2,464 | $145,658 | $139,044 | $6,614 |
| 2018 | $2,316 | $142,803 | $136,318 | $6,485 |
| 2017 | $2,247 | $140,004 | $133,646 | $6,358 |
| 2016 | $2,192 | $137,260 | $131,026 | $6,234 |
| 2015 | $2,142 | $135,199 | $129,058 | $6,141 |
| 2014 | $2,007 | $132,551 | $126,530 | $6,021 |
Source: Public Records
Map
Nearby Homes
- 1225 Island Ave Unit 208
- 1225 Island Ave Unit 611
- 525 11th Ave Unit 1116
- 525 11th Ave Unit 1405
- 550 Park Blvd Unit 2306
- 550 15th St Unit 403
- 550 15th St Unit 102
- 550 15th St Unit 401
- 1150 J St Unit 111
- 1150 J St Unit 104
- 1150 J St Unit 323
- 1150 J St Unit 220
- 1150 J St Unit 406
- 1050 Island Ave Unit 609
- 1050 Island Ave Unit 405
- 1050 Island Ave Unit 706
- 1025 Island Ave Unit 402
- 1025 Island Ave Unit 407
- 350 11th Ave Unit 133
- 350 11th Ave Unit 134
- 528 14th St
- 555 Park Blvd
- 0 Doug Hill Lot 13 2
- 0 Doug Hill Lot 13 2 Unit 13, 2 120042824
- 453 13th St Unit 554
- 453 13th St
- 453 13th St
- 509 Park Blvd
- 525 14th St
- 1228 Island Ave
- 1233 Island Ave Unit 45
- 1233 (& 12 Island Ave
- 1233 (& 12 Island Ave
- 1233 & 124 1233 & 1245 Island Ave
- 1233 & 1245 Island Ave
- 1330 Market St Unit 460
- 1330 Market St Unit 558
- 1330 Market St Unit 636
- 1330 Market St
- 1444 Island Ave