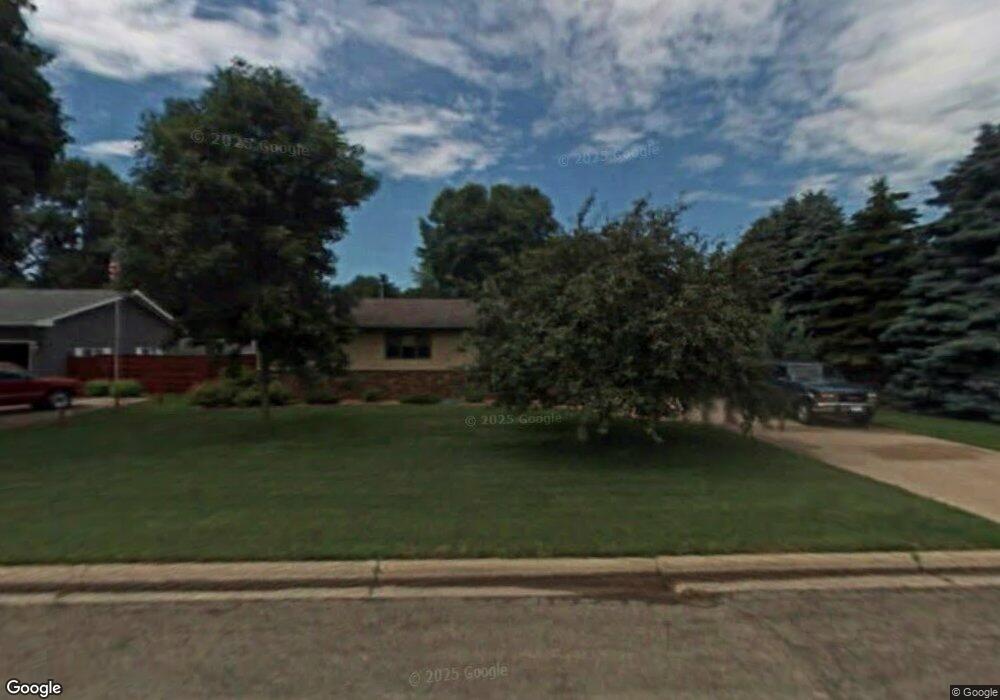
537 6th Ave N Cold Spring, MN 56320
Estimated Value: $247,000 - $268,000
About This Home
This home is located at 537 6th Ave N, Cold Spring, MN 56320 and is currently estimated at $257,388, approximately $174 per square foot. 537 6th Ave N is a home located in Stearns County with nearby schools including Rocori Senior High School, Dei Spring Academy, and St. Boniface School.
Ownership History
We collect this data history from publicly available records. To have your information removed, we recommend requesting removal directly through your county’s website.
Purchase Details
Home Financials for this Owner
Home Financials are based on the most recent Mortgage that was taken out on this home.Purchase Details
Home Values in the Area
Average Home Value in this Area
Purchase History
We collect this data history from publicly available records. To have your information removed, we recommend requesting removal directly through your county’s website.
| Date | Buyer | Sale Price | Title Company |
|---|---|---|---|
| $233,500 | -- | ||
| $147,000 | -- |
Mortgage History
We collect this data history from publicly available records. To have your information removed, we recommend requesting removal directly through your county’s website.
| Date | Status | Borrower | Loan Amount |
|---|---|---|---|
| Open | $228,500 |
Tax History
We collect this data history from publicly available records. To have your information removed, we recommend requesting removal directly through your county’s website.
| Year | Tax Paid | Tax Assessment Tax Assessment Total Assessment is a certain percentage of the fair market value that is determined by local assessors to be the total taxable value of land and additions on the property. | Land | Improvement |
|---|---|---|---|---|
| 2025 | $2,436 | $220,300 | $42,400 | $177,900 |
| 2024 | $2,270 | $206,800 | $42,400 | $164,400 |
| 2023 | $2,200 | $201,000 | $42,400 | $158,600 |
| 2022 | $2,198 | $162,000 | $35,000 | $127,000 |
| 2021 | $2,298 | $162,000 | $35,000 | $127,000 |
| 2020 | $3,024 | $166,400 | $37,000 | $129,400 |
| 2019 | $3,052 | $153,200 | $35,000 | $118,200 |
| 2018 | $2,934 | $133,900 | $30,000 | $103,900 |
| 2017 | $2,904 | $127,300 | $25,000 | $102,300 |
| 2016 | $2,832 | $0 | $0 | $0 |
| 2015 | $2,820 | $0 | $0 | $0 |
| 2014 | -- | $0 | $0 | $0 |
Map
- 420 6th Ave N
- 106 River Oaks Dr
- 314 Bogey Ln
- 419 2nd St N
- 138 River Oaks Dr
- 904 3rd St N Unit 9
- 912 3rd St N Unit 7
- 205 11th St N
- 409 12th St N
- 307 12th St N
- 300 7th Ave S
- 310 14th St N
- 106 City View Rd
- 407 Red River Ave S
- 310 15th St N
- 104 City View Rd
- 113 17th Ave N
- 311 15th St N
- 1604 1st St N
- 1609 1st St N
Ask me questions while you tour the home.