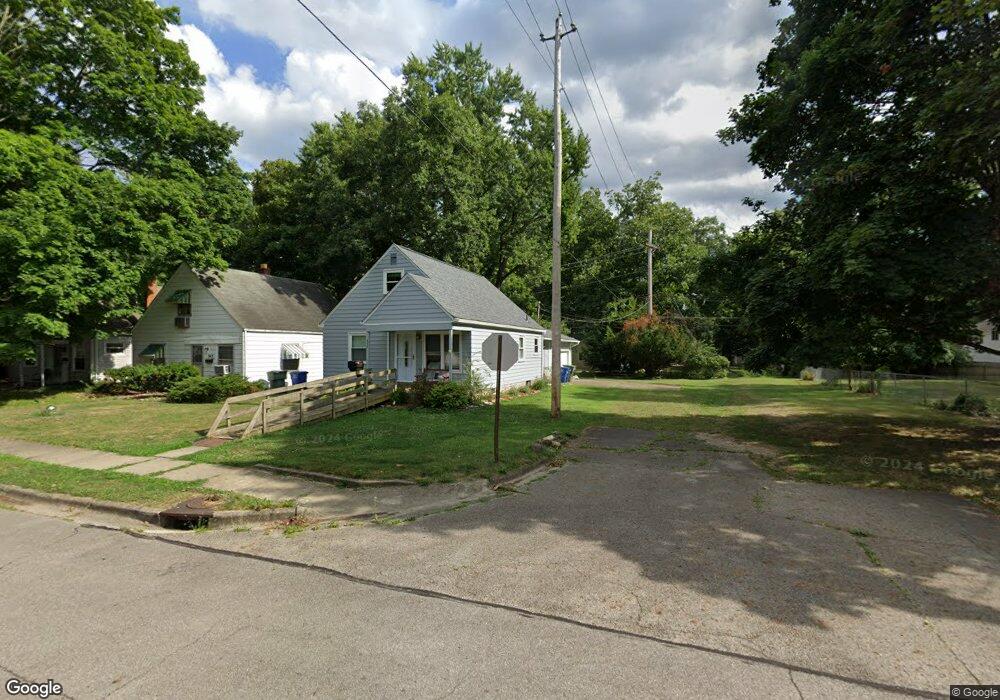
537 Chase Rd Columbus, OH 43214
Clintonville NeighborhoodEstimated Value: $287,072 - $317,000
2
Beds
1
Bath
1,044
Sq Ft
$289/Sq Ft
Est. Value
About This Home
This home is located at 537 Chase Rd, Columbus, OH 43214 and is currently estimated at $301,268, approximately $288 per square foot. 537 Chase Rd is a home located in Franklin County with nearby schools including Salem Elementary School, Dominion Middle School, and Whetstone High School.
Ownership History
Date
Name
Owned For
Owner Type
Purchase Details
Closed on
Jul 29, 2024
Sold by
Mumford Martha M
Bought by
Martha M Mumford Payback Special Needs Trust and Milligan
Current Estimated Value
Purchase Details
Closed on
Jun 1, 2018
Sold by
Mumford Martha M and Mumford Richard S
Bought by
Mumford Martha M
Purchase Details
Closed on
May 11, 2006
Sold by
Mumford Martha M and Mumford Richard S
Bought by
Mumford Richard S and Mumford Martha M
Purchase Details
Closed on
Nov 29, 1993
Bought by
Milligan Martha S
Purchase Details
Closed on
Nov 9, 1993
Purchase Details
Closed on
Jan 1, 1986
Create a Home Valuation Report for This Property
The Home Valuation Report is an in-depth analysis detailing your home's value as well as a comparison with similar homes in the area
Home Values in the Area
Average Home Value in this Area
Purchase History
We collect this data history from publicly available records. To have your information removed, we recommend requesting removal directly through your county’s website.
| Date | Buyer | Sale Price | Title Company |
|---|---|---|---|
| Martha M Mumford Payback Special Needs Trust | -- | Title Connect Agency | |
| Mumford Martha M | -- | Independent Title Svcs Inc | |
| Mumford Richard S | -- | None Available | |
| Milligan Martha S | $68,000 | -- | |
| -- | -- | -- | |
| -- | $48,900 | -- |
Source: Public Records
Tax History
| Year | Tax Paid | Tax Assessment Tax Assessment Total Assessment is a certain percentage of the fair market value that is determined by local assessors to be the total taxable value of land and additions on the property. | Land | Improvement |
|---|---|---|---|---|
| 2025 | $3,880 | $86,450 | $28,140 | $58,310 |
| 2024 | $3,880 | $86,450 | $28,140 | $58,310 |
| 2023 | $3,830 | $86,450 | $28,140 | $58,310 |
| 2022 | $3,547 | $68,390 | $12,530 | $55,860 |
| 2021 | $3,606 | $68,390 | $12,530 | $55,860 |
| 2020 | $3,558 | $68,390 | $12,530 | $55,860 |
| 2019 | $3,185 | $52,500 | $9,660 | $42,840 |
| 2018 | $2,633 | $52,500 | $9,660 | $42,840 |
| 2017 | $2,477 | $52,500 | $9,660 | $42,840 |
| 2016 | $2,301 | $43,480 | $10,890 | $32,590 |
| 2015 | $2,088 | $43,480 | $10,890 | $32,590 |
| 2014 | $2,094 | $43,480 | $10,890 | $32,590 |
| 2013 | $971 | $41,405 | $10,360 | $31,045 |
Source: Public Records
Map
Nearby Homes
- 641 E Lincoln Ave
- 448 Chase Rd
- 458 E Stanton Ave
- 5451 Sharon Park Ave
- 5442 Worthington Forest Place W
- 548 Loveman Ave
- 5421 Worthington Forest Place E
- 5479 Worthington Forest Place E Unit 5479
- 368 Kenbrook Dr
- 318 E Stanton Ave
- 360 Kenbrook Dr
- 296 E Stanton Ave
- 5274 Sinclair Rd
- 539 Colonial Ave
- 5470 Crawford Dr
- 990 Strimple Ave
- 909 Hillery Rd
- 529 Plymouth St
- 5716 N Meadows Blvd
- 5667 Roche Dr
- 543 Chase Rd
- 557 Chase Rd
- 563 Chase Rd
- 0 E Lincoln Ave
- 0 E Lincoln Ave
- 554 E Lincoln Ave
- 538 E Lincoln Ave
- 560 E Lincoln Ave
- 523 Chase Rd
- 552 Chase Rd
- 548 Chase Rd
- 564 E Lincoln Ave
- 538 Chase Rd
- 558 Chase Rd
- 524 E Lincoln Ave
- 562 Chase Rd
- 517 Chase Rd
- 575 Chase Rd
- 522 E Lincoln Ave
- 572 E Lincoln Ave
Your Personal Tour Guide
Ask me questions while you tour the home.