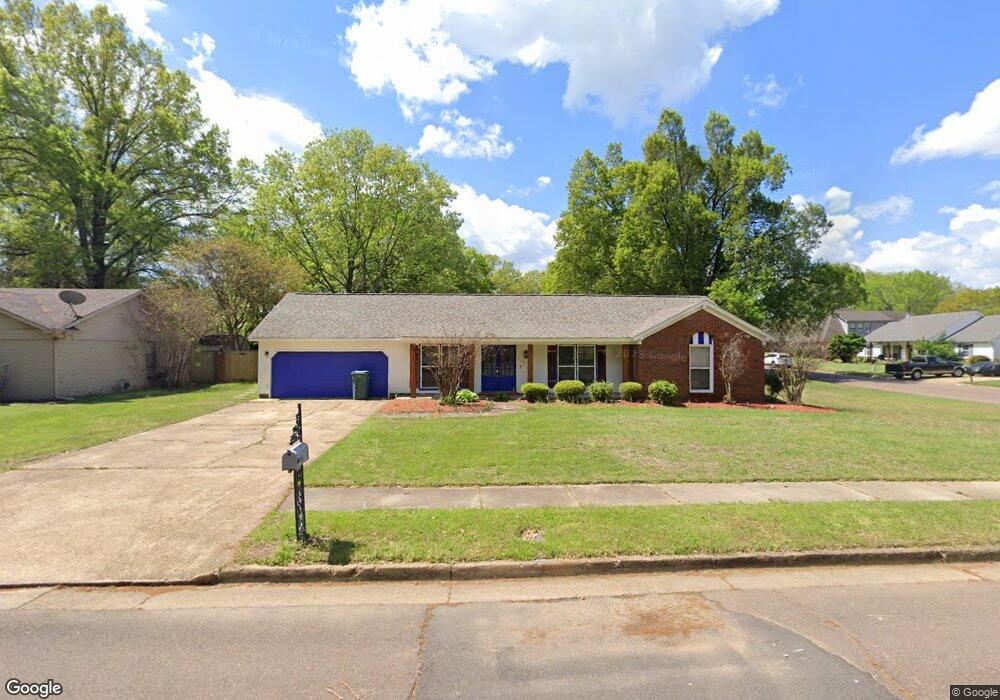
537 Cypress Dr Southaven, MS 38671
Estimated Value: $240,358 - $274,000
3
Beds
--
Bath
2,174
Sq Ft
$119/Sq Ft
Est. Value
About This Home
This home is located at 537 Cypress Dr, Southaven, MS 38671 and is currently estimated at $259,090, approximately $119 per square foot. 537 Cypress Dr is a home located in DeSoto County with nearby schools including Greenbrook Elementary School, Southaven Intermediate School, and Southaven Middle School.
Ownership History
Date
Name
Owned For
Owner Type
Purchase Details
Closed on
Jul 19, 2024
Sold by
Ramsey Dewey Franklin and Ramsey Abigail Mari
Bought by
Hicks Nehemiah and Hicks Brandy Alexandria
Current Estimated Value
Home Financials for this Owner
Home Financials are based on the most recent Mortgage that was taken out on this home.
Original Mortgage
$245,471
Outstanding Balance
$242,173
Interest Rate
6.37%
Mortgage Type
FHA
Estimated Equity
$16,917
Purchase Details
Closed on
May 8, 2020
Sold by
Ramsey Elizabeth A and Craddock Diana Z
Bought by
Ramsey Dewey Franklin and Ponder Abigail Marie
Home Financials for this Owner
Home Financials are based on the most recent Mortgage that was taken out on this home.
Original Mortgage
$78,551
Interest Rate
3.3%
Mortgage Type
FHA
Create a Home Valuation Report for This Property
The Home Valuation Report is an in-depth analysis detailing your home's value as well as a comparison with similar homes in the area
Home Values in the Area
Average Home Value in this Area
Purchase History
| Date | Buyer | Sale Price | Title Company |
|---|---|---|---|
| Hicks Nehemiah | -- | None Listed On Document | |
| Hicks Nehemiah | -- | None Listed On Document | |
| Ramsey Dewey Franklin | -- | None Available |
Source: Public Records
Mortgage History
| Date | Status | Borrower | Loan Amount |
|---|---|---|---|
| Open | Hicks Nehemiah | $245,471 | |
| Closed | Hicks Nehemiah | $245,471 | |
| Previous Owner | Ramsey Dewey Franklin | $78,551 |
Source: Public Records
Tax History Compared to Growth
Tax History
| Year | Tax Paid | Tax Assessment Tax Assessment Total Assessment is a certain percentage of the fair market value that is determined by local assessors to be the total taxable value of land and additions on the property. | Land | Improvement |
|---|---|---|---|---|
| 2024 | $1,563 | $12,818 | $2,500 | $10,318 |
| 2023 | $1,563 | $12,818 | $0 | $0 |
| 2022 | $1,524 | $12,818 | $2,500 | $10,318 |
| 2021 | $1,524 | $12,818 | $2,500 | $10,318 |
| 2020 | $1,707 | $11,992 | $2,500 | $9,492 |
| 2019 | $1,707 | $11,992 | $2,500 | $9,492 |
| 2017 | $1,687 | $21,086 | $11,793 | $9,293 |
| 2016 | $1,687 | $11,793 | $2,500 | $9,293 |
| 2015 | $1,680 | $21,086 | $11,793 | $9,293 |
| 2014 | $1,687 | $11,793 | $0 | $0 |
| 2013 | $1,687 | $11,793 | $0 | $0 |
Source: Public Records
Map
Nearby Homes
- 8647 Greenway Rd
- 001 Lakeshore Dr
- 8644 Woodbine Dr
- 8610 Lakeshore Dr W
- 8615 Bridgewood Dr
- 708 Thornwood Dr
- 353 Plum Point Place
- 8355 Greenbrook Pkwy
- 864 Hackberry Dr
- 754 Valley Springs Dr
- 300 Flower Garden Dr
- 308 Flower Garden Dr
- 343 Flower Garden Dr
- 335 Flower Garden Dr
- 327 Flower Garden Dr
- 219 Flower Garden Dr
- 413 Country Garden Dr
- 351 Country Garden Dr
- 274 Country Garden Dr
- 266 Country Garden Dr
- 551 Cypress Dr
- 551 S Cypress
- 8850 Cypress Cove
- 573 Cypress Dr
- 536 Cypress Dr
- 8840 Cypress Cove
- 8851 Cypress Cove
- 522 Pin Oak Point
- 8867 Cypress Cove
- 8841 Cypress Cove
- 587 Cypress Dr
- 8836 Cypress Cove
- 572 Cypress Dr
- 510 Pin Oak Point
- 586 Cypress Dr
- 8837 Cypress Cove
- 538 Pin Oak Point
- 8830 Cypress Cove
- 591 Cypress Dr