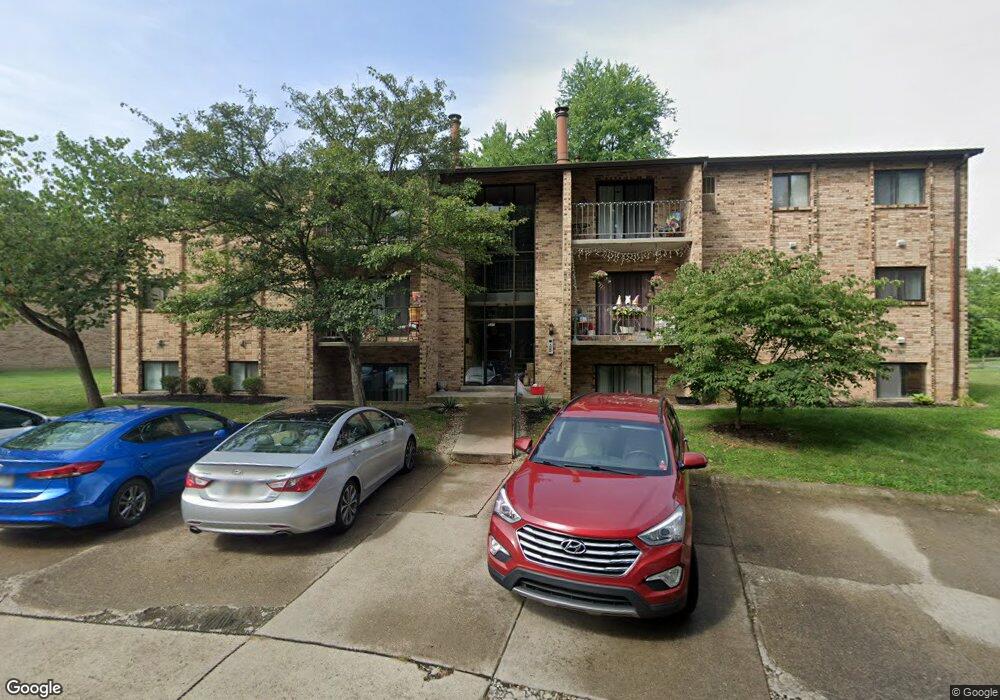
537 Davis Rd Unit 13 Cincinnati, OH 45255
Estimated Value: $113,000 - $122,647
2
Beds
2
Baths
943
Sq Ft
$123/Sq Ft
Est. Value
About This Home
This home is located at 537 Davis Rd Unit 13, Cincinnati, OH 45255 and is currently estimated at $116,412, approximately $123 per square foot. 537 Davis Rd Unit 13 is a home located in Clermont County with nearby schools including Withamsville-Tobasco Elementary School, West Clermont Middle School, and West Clermont High School.
Ownership History
Date
Name
Owned For
Owner Type
Purchase Details
Closed on
Sep 19, 2025
Sold by
Quinlan Frances M and Quinlan Marian Frances
Bought by
Yoss Nancy M
Current Estimated Value
Home Financials for this Owner
Home Financials are based on the most recent Mortgage that was taken out on this home.
Original Mortgage
$65,000
Outstanding Balance
$65,000
Interest Rate
6.63%
Mortgage Type
New Conventional
Estimated Equity
$51,412
Purchase Details
Closed on
Jun 25, 2010
Sold by
Bowling Michael C and Bowling Connie J
Bought by
Bowling Michael C and Bowling Connie J
Purchase Details
Closed on
Aug 10, 2006
Sold by
Bowling Michael C and Bowling Connie J
Bought by
Bowling Michael C and Bowling Connie J
Home Financials for this Owner
Home Financials are based on the most recent Mortgage that was taken out on this home.
Original Mortgage
$52,125
Interest Rate
6.85%
Mortgage Type
Unknown
Purchase Details
Closed on
Mar 21, 1995
Sold by
Oldovan Ellen E
Bought by
Partack James N
Home Financials for this Owner
Home Financials are based on the most recent Mortgage that was taken out on this home.
Original Mortgage
$48,307
Interest Rate
10%
Mortgage Type
VA
Purchase Details
Closed on
Dec 1, 1985
Create a Home Valuation Report for This Property
The Home Valuation Report is an in-depth analysis detailing your home's value as well as a comparison with similar homes in the area
Purchase History
| Date | Buyer | Sale Price | Title Company |
|---|---|---|---|
| Yoss Nancy M | $115,000 | None Listed On Document | |
| Yoss Nancy M | $115,000 | None Listed On Document | |
| Bowling Michael C | -- | Attorney | |
| Bowling Michael C | -- | Prodigy Title Agency Llc | |
| Bowling Michael J | $69,500 | Prodigy Title Agency | |
| Partack James N | $48,307 | -- | |
| -- | $37,900 | -- |
Source: Public Records
Mortgage History
| Date | Status | Borrower | Loan Amount |
|---|---|---|---|
| Open | Yoss Nancy M | $65,000 | |
| Closed | Yoss Nancy M | $65,000 | |
| Previous Owner | Bowling Michael J | $52,125 | |
| Previous Owner | Partack James N | $48,307 |
Source: Public Records
Tax History
| Year | Tax Paid | Tax Assessment Tax Assessment Total Assessment is a certain percentage of the fair market value that is determined by local assessors to be the total taxable value of land and additions on the property. | Land | Improvement |
|---|---|---|---|---|
| 2024 | $1,121 | $31,750 | $5,290 | $26,460 |
| 2023 | $1,155 | $31,750 | $5,290 | $26,460 |
| 2022 | $723 | $21,040 | $3,500 | $17,540 |
| 2021 | $715 | $21,040 | $3,500 | $17,540 |
| 2020 | $715 | $21,040 | $3,500 | $17,540 |
| 2019 | $445 | $17,050 | $1,470 | $15,580 |
| 2018 | $449 | $17,050 | $1,470 | $15,580 |
| 2017 | $447 | $17,050 | $1,470 | $15,580 |
| 2016 | $447 | $16,240 | $1,400 | $14,840 |
| 2015 | $935 | $16,240 | $1,400 | $14,840 |
| 2014 | $935 | $16,240 | $1,400 | $14,840 |
| 2013 | $1,108 | $19,120 | $1,580 | $17,540 |
Source: Public Records
Map
Nearby Homes
- 537 Davis Rd
- 541 Davis Rd
- 595 Davis Rd
- 488 Madeira Ct
- 3904 Columbard Ln
- 807 Nordyke Rd
- 551 Hal Cor Ln
- 637 Ellen Dr
- 671 Mccormick Ln
- 492 Mapleleaf Dr
- 496 Mapleleaf Dr
- 4047 Mclean Dr
- 3703 Nine Mile Tobasco Rd
- 4077 Mclean Dr
- 8372 Benton Ridge Ln
- 8303 Tidewater Ct
- 686 Loda Dr
- 4133 Brandonmore Dr
- 8016 Hignite Ct
- 8345 Cherry Ln
- 537 Davis Rd Unit 23
- 537 Davis Rd Unit 22
- 537 Davis Rd Unit 21
- 537 Davis Rd Unit 20
- 537 Davis Rd
- 537 Davis Rd Unit 18
- 537 Davis Rd Unit 17
- 537 Davis Rd Unit 16
- 537 Davis Rd Unit 15
- 537 Davis Rd Unit 24
- 537 Davis Rd Unit 10
- 537 Davis Rd Unit 12
- 537 Davis Rd Unit 6
- 537 Davis Rd Unit 11
- 537 Davis Rd Unit 9
- 537 Davis Rd Unit 3
- 537 Davis Rd Unit 2
- 537 Davis Rd Unit 7
- 537 Davis Rd Unit 5
- 537 Davis Rd Unit 1
Your Personal Tour Guide
Ask me questions while you tour the home.