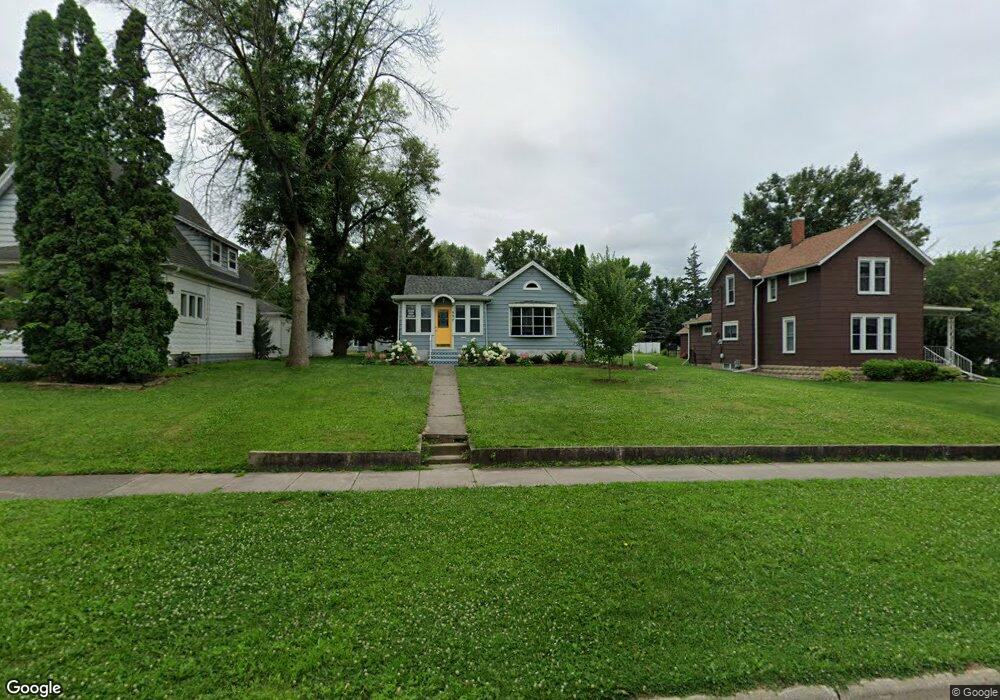
537 E Broadway St Owatonna, MN 55060
Estimated Value: $182,343 - $209,000
2
Beds
1
Bath
1,656
Sq Ft
$119/Sq Ft
Est. Value
About This Home
This home is located at 537 E Broadway St, Owatonna, MN 55060 and is currently estimated at $197,086, approximately $119 per square foot. 537 E Broadway St is a home located in Steele County with nearby schools including Washington Elementary School, Owatonna Middle School, and Owatonna Senior High School.
Ownership History
Date
Name
Owned For
Owner Type
Purchase Details
Closed on
Sep 28, 2020
Sold by
Compton Jenna R
Bought by
Charlton Elizabeth
Current Estimated Value
Home Financials for this Owner
Home Financials are based on the most recent Mortgage that was taken out on this home.
Original Mortgage
$143,434
Outstanding Balance
$127,577
Interest Rate
2.9%
Mortgage Type
New Conventional
Estimated Equity
$69,509
Purchase Details
Closed on
Oct 17, 2011
Sold by
Dunnington Barbara and Dunnington Ronald
Bought by
Compton Jenna R
Home Financials for this Owner
Home Financials are based on the most recent Mortgage that was taken out on this home.
Original Mortgage
$80,750
Interest Rate
4.12%
Mortgage Type
New Conventional
Purchase Details
Closed on
Jun 29, 2010
Sold by
Harris Eleanor
Bought by
Dunnington Barbara and Harris Jarome
Create a Home Valuation Report for This Property
The Home Valuation Report is an in-depth analysis detailing your home's value as well as a comparison with similar homes in the area
Home Values in the Area
Average Home Value in this Area
Purchase History
| Date | Buyer | Sale Price | Title Company |
|---|---|---|---|
| Charlton Elizabeth | $142,500 | North American Title | |
| Compton Jenna R | $85,000 | North American Title Company | |
| Dunnington Barbara | -- | None Available |
Source: Public Records
Mortgage History
| Date | Status | Borrower | Loan Amount |
|---|---|---|---|
| Open | Charlton Elizabeth | $143,434 | |
| Previous Owner | Compton Jenna R | $80,750 |
Source: Public Records
Tax History
| Year | Tax Paid | Tax Assessment Tax Assessment Total Assessment is a certain percentage of the fair market value that is determined by local assessors to be the total taxable value of land and additions on the property. | Land | Improvement |
|---|---|---|---|---|
| 2025 | $1,898 | $163,000 | $29,000 | $134,000 |
| 2024 | $1,884 | $152,300 | $23,900 | $128,400 |
| 2023 | $1,872 | $143,100 | $23,600 | $119,500 |
| 2022 | $1,602 | $137,500 | $22,400 | $115,100 |
| 2021 | $1,162 | $111,132 | $20,482 | $90,650 |
| 2020 | $1,152 | $87,318 | $20,482 | $66,836 |
| 2019 | $876 | $84,280 | $20,482 | $63,798 |
| 2018 | $1,064 | $72,226 | $17,542 | $54,684 |
| 2017 | $1,106 | $70,070 | $13,426 | $56,644 |
| 2016 | $1,150 | $65,954 | $13,426 | $52,528 |
| 2015 | -- | $0 | $0 | $0 |
| 2014 | -- | $0 | $0 | $0 |
Source: Public Records
Map
Nearby Homes
- 216 Lincoln Ave
- 551 Agnes St
- 410 E Vine St
- 230 Spruce Ave
- 603 E Academy St
- 315 N Pine Ave
- 331 E Vine St
- 733 E Academy St
- 646 E Rose St
- 609 Harriet Ave
- 234 E School St
- 238 Locust Ave
- 70 Aspen Highland Place
- 430 S Elm Ave
- 246 Willow Ave
- 817 Harriet Ave
- 144 E Rose St
- 562 Maple Dr
- 714 South St
- xxx S Lincoln Ave
- 537 537 Broadway-Street-e
- 533 E Broadway St
- 543 E Broadway St
- 603 E Broadway St
- 115 Lincoln Ave
- 524 E Main St
- 109 Lincoln Ave
- 518 E Main St
- 530 E Main St
- 544 E Broadway St
- 538 E Broadway St
- 512 E Main St
- 609 E Broadway St
- 609 609 Broadway-Street-e
- 534 E Broadway St
- 536 E Main St
- 528 E Broadway St
- 524 E Broadway St
- 506 E Main St
- 604 E Broadway St
Your Personal Tour Guide
Ask me questions while you tour the home.