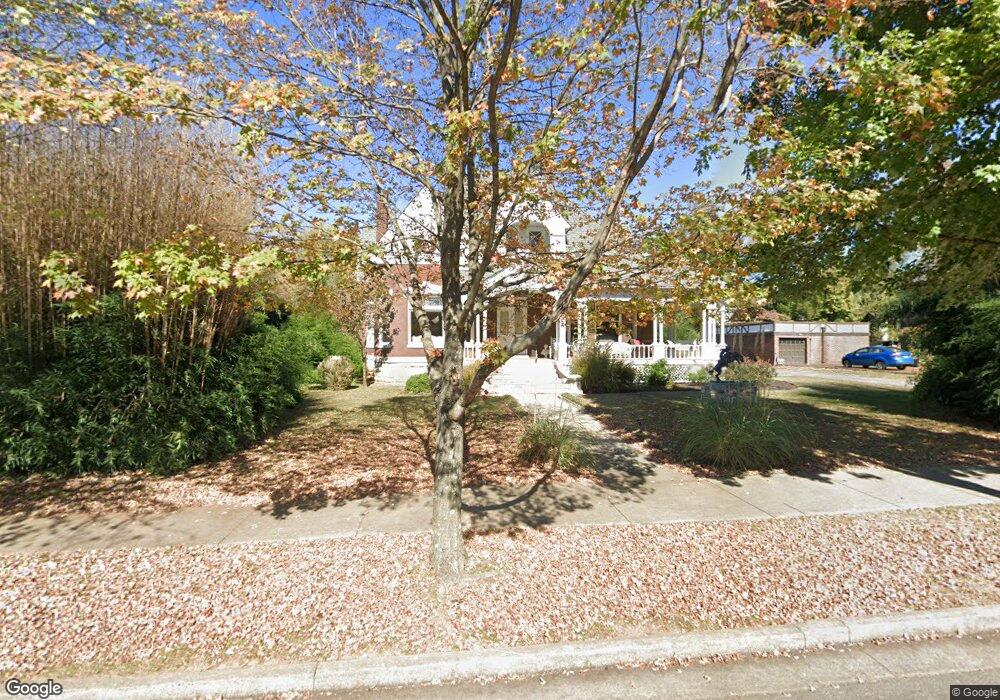
537 E Main St Murfreesboro, TN 37130
Estimated Value: $898,000 - $1,075,000
Studio
4
Baths
4,382
Sq Ft
$229/Sq Ft
Est. Value
About This Home
This home is located at 537 E Main St, Murfreesboro, TN 37130 and is currently estimated at $1,001,897, approximately $228 per square foot. 537 E Main St is a home located in Rutherford County with nearby schools including Hobgood Elementary School, Whitworth-Buchanan Middle School, and Oakland High School.
Ownership History
Date
Name
Owned For
Owner Type
Purchase Details
Closed on
Dec 20, 2023
Sold by
Sims Larry G
Bought by
Sims Lisa G
Current Estimated Value
Purchase Details
Closed on
Dec 31, 2008
Sold by
Prince John Allen
Bought by
Sims Larry
Home Financials for this Owner
Home Financials are based on the most recent Mortgage that was taken out on this home.
Original Mortgage
$357,500
Interest Rate
5.48%
Create a Home Valuation Report for This Property
The Home Valuation Report is an in-depth analysis detailing your home's value as well as a comparison with similar homes in the area
Home Values in the Area
Average Home Value in this Area
Purchase History
| Date | Buyer | Sale Price | Title Company |
|---|---|---|---|
| Sims Lisa G | -- | None Listed On Document | |
| Sims Lisa G | -- | None Listed On Document | |
| Sims Larry | $387,500 | -- |
Source: Public Records
Mortgage History
| Date | Status | Borrower | Loan Amount |
|---|---|---|---|
| Previous Owner | Sims Larry | $357,500 |
Source: Public Records
Tax History
| Year | Tax Paid | Tax Assessment Tax Assessment Total Assessment is a certain percentage of the fair market value that is determined by local assessors to be the total taxable value of land and additions on the property. | Land | Improvement |
|---|---|---|---|---|
| 2025 | $4,926 | $174,150 | $35,000 | $139,150 |
| 2024 | $4,926 | $174,150 | $35,000 | $139,150 |
| 2023 | $3,267 | $174,150 | $35,000 | $139,150 |
| 2022 | $2,815 | $174,150 | $35,000 | $139,150 |
| 2021 | $2,651 | $119,425 | $25,000 | $94,425 |
| 2020 | $2,651 | $119,425 | $25,000 | $94,425 |
| 2019 | $2,651 | $119,425 | $25,000 | $94,425 |
| 2018 | $3,641 | $119,425 | $0 | $0 |
| 2017 | $4,558 | $117,275 | $0 | $0 |
| 2016 | $4,558 | $117,275 | $0 | $0 |
| 2015 | $4,558 | $117,275 | $0 | $0 |
| 2014 | $2,916 | $117,275 | $0 | $0 |
| 2013 | -- | $97,725 | $0 | $0 |
Source: Public Records
Map
Nearby Homes
- 920 Ewing Blvd
- 1153 E Main St
- 202 2nd Ave
- 726 Kalu Dr
- 730 E Burton St
- 1009 Greenland Dr
- 812 Greenland Dr
- 802 E Main St Unit 16
- 319 Minerva Dr
- 222 Kerr Ave
- 1641 Center Pointe Dr
- 434 Hawkins Ave
- 1810 Dr Martin Luther King jr Blvd
- 1814 Dr Martin Luther King jr Blvd
- 1245 Old Lascassas Rd Unit E1
- 1245 Old Lascassas Rd Unit C
- 121 Gayle Ln
- 805 N Highland Ave
- 445 Jackson St
- 1511 Diana St
- 516 E Main St Unit 518
- 628 E Main St
- 346 E Main St
- 2403 Middle Tennessee Blvd Unit 5
- 2505 Middle Tennessee Blvd
- 323 E Main St
- 1109 E Bell St
- 2511 Middle Tennessee Blvd
- 2517 Middle Tennessee Blvd
- 1212 E Main St
- 2523 Middle Tennessee Blvd
- 2529 Middle Tennessee Blvd
- 1109 Ewing Blvd
- 1102 Ewing Blvd
- 2535 Middle Tennessee Blvd
- 1105 Ewing Blvd
- 2541 Middle Tennessee Blvd Unit 47
- 610 Crestland Ave
- 618 Crestland Ave
- 1016 Ewing Blvd
Your Personal Tour Guide
Ask me questions while you tour the home.