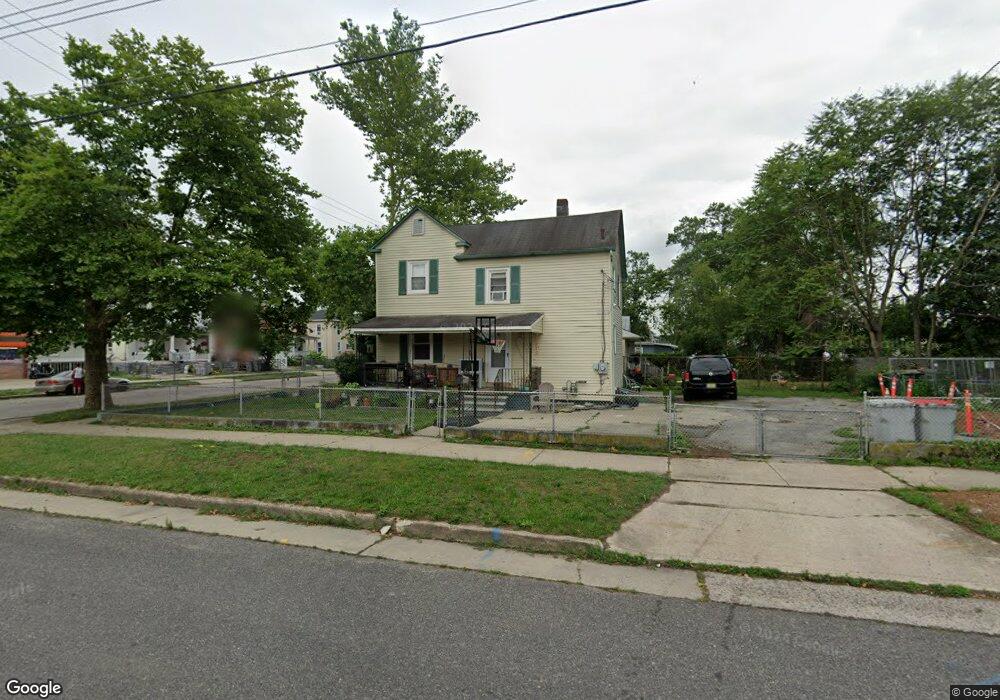
537 E Quince St Vineland, NJ 08360
Estimated Value: $198,000 - $235,863
--
Bed
--
Bath
1,320
Sq Ft
$160/Sq Ft
Est. Value
About This Home
This home is located at 537 E Quince St, Vineland, NJ 08360 and is currently estimated at $210,966, approximately $159 per square foot. 537 E Quince St is a home located in Cumberland County with nearby schools including Gloria M. Sabater Elementary School, Landis Middle School, and Vineland Senior High School.
Ownership History
Date
Name
Owned For
Owner Type
Purchase Details
Closed on
Jun 30, 2003
Sold by
Sanders Robert W
Bought by
Santiago Fernando
Current Estimated Value
Home Financials for this Owner
Home Financials are based on the most recent Mortgage that was taken out on this home.
Original Mortgage
$77,900
Outstanding Balance
$33,618
Interest Rate
5.46%
Estimated Equity
$177,348
Create a Home Valuation Report for This Property
The Home Valuation Report is an in-depth analysis detailing your home's value as well as a comparison with similar homes in the area
Home Values in the Area
Average Home Value in this Area
Purchase History
| Date | Buyer | Sale Price | Title Company |
|---|---|---|---|
| Santiago Fernando | $82,000 | -- |
Source: Public Records
Mortgage History
| Date | Status | Borrower | Loan Amount |
|---|---|---|---|
| Open | Santiago Fernando | $77,900 |
Source: Public Records
Tax History Compared to Growth
Tax History
| Year | Tax Paid | Tax Assessment Tax Assessment Total Assessment is a certain percentage of the fair market value that is determined by local assessors to be the total taxable value of land and additions on the property. | Land | Improvement |
|---|---|---|---|---|
| 2025 | $3,891 | $122,200 | $15,000 | $107,200 |
| 2024 | $3,891 | $122,200 | $15,000 | $107,200 |
| 2023 | $3,865 | $122,200 | $15,000 | $107,200 |
| 2022 | $3,750 | $122,200 | $15,000 | $107,200 |
| 2021 | $3,682 | $122,200 | $15,000 | $107,200 |
| 2020 | $3,577 | $122,200 | $15,000 | $107,200 |
| 2019 | $3,528 | $122,200 | $15,000 | $107,200 |
| 2018 | $3,435 | $122,200 | $15,000 | $107,200 |
| 2017 | $3,263 | $122,200 | $15,000 | $107,200 |
| 2016 | $3,148 | $122,200 | $15,000 | $107,200 |
| 2015 | $3,032 | $122,200 | $15,000 | $107,200 |
| 2014 | $2,867 | $122,200 | $15,000 | $107,200 |
Source: Public Records
Map
Nearby Homes
- 406 S 6th St
- 511 E Grape St
- 739 E Montrose St
- 724 E Grape St
- 306 S East Ave
- 729 E Landis Ave
- 818 E Grape St
- 404 Montrose St
- 810 Washington Ave
- 719 3rd Street Terrace
- 218 W Montrose St
- 313 W Wood St
- 18 S Myrtle St
- 636 E Pear St
- 400 N 7th St
- 27 S State St
- 110 W Elmer St
- 818 E Pear St
- 66 W Walnut Rd
- 3 N State St